Want to see RevSure in action
Schedule a 30-minute demo
Book a Demo
Back to Templates


Gain real-time visibility into pipeline strength, efficiency, and progression
Pipeline is the foundation of predictable revenue, yet most teams lack a clear, consolidated view of its true health. Marketing tracks lead volume, sales focuses on active deals, and RevOps manages multiple reports across systems. Leadership sees forecasts but often without full context on whether the pipeline can support them.
RevSure’s Pipeline Health Dashboard Template brings pipeline coverage, stage balance, conversion performance, and velocity into a single unified view. It enables teams to identify risks early, understand where performance is breaking down, and take action before revenue targets are impacted.
This template is designed for B2B organizations with complex sales cycles and multi-channel demand generation strategies. Revenue leaders, sales operations, and RevOps teams rely on it to maintain visibility into pipeline performance and ensure alignment across teams.
Marketing teams use it to ensure sufficient pipeline is being generated. Sales teams use it to focus on progressing the right deals. Leadership uses it to evaluate whether current pipeline can support forecasted revenue.
By bringing these perspectives together, the dashboard creates a shared understanding of pipeline health across the organization.
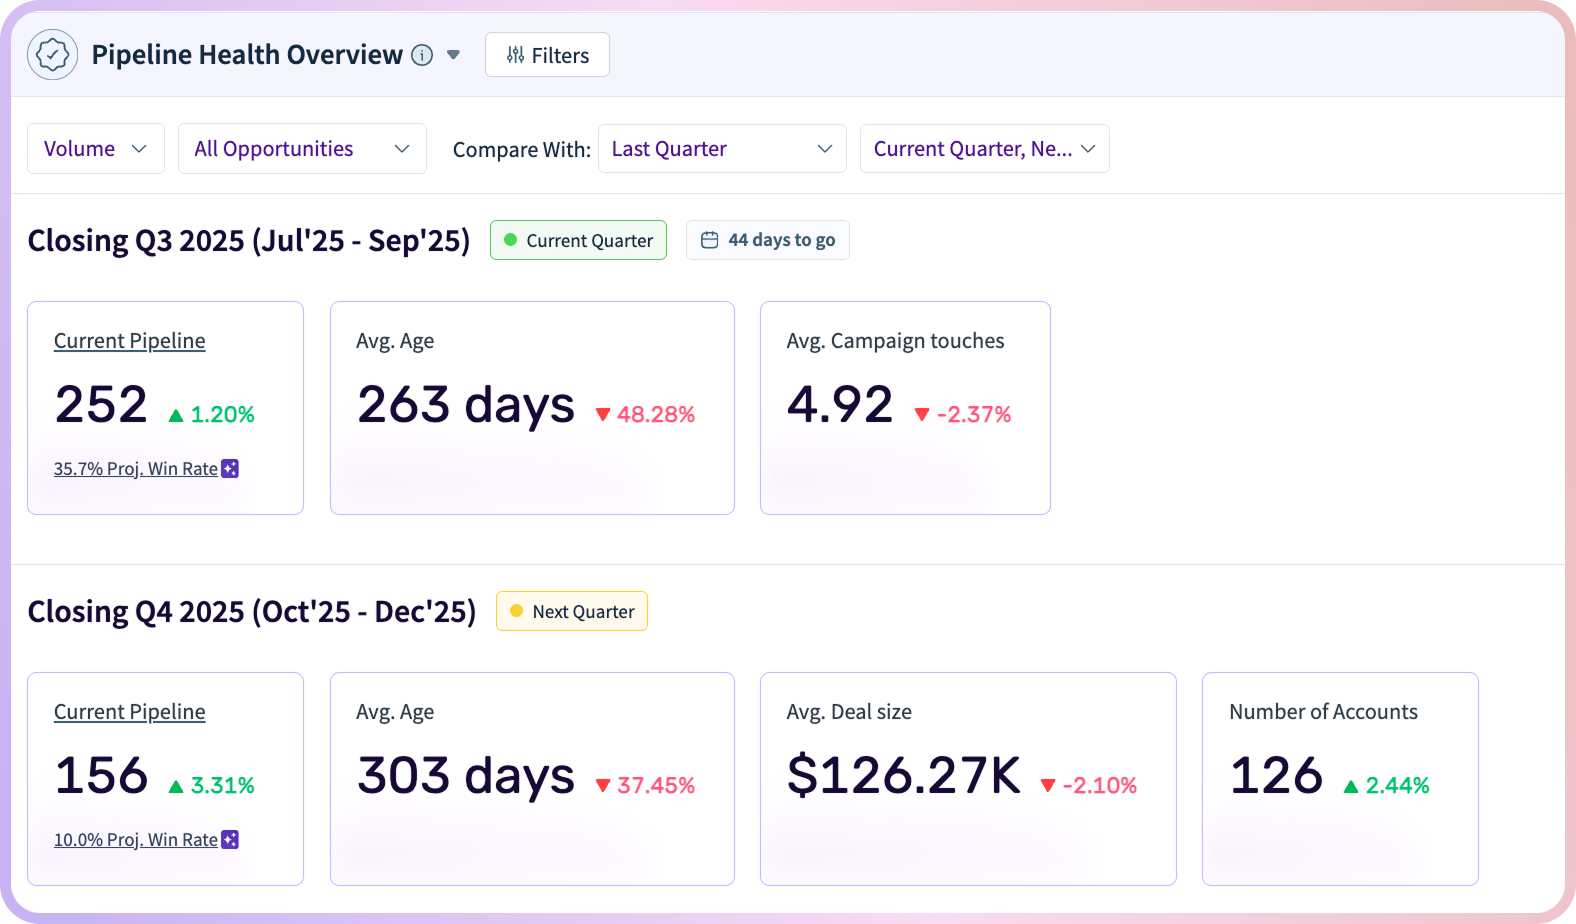
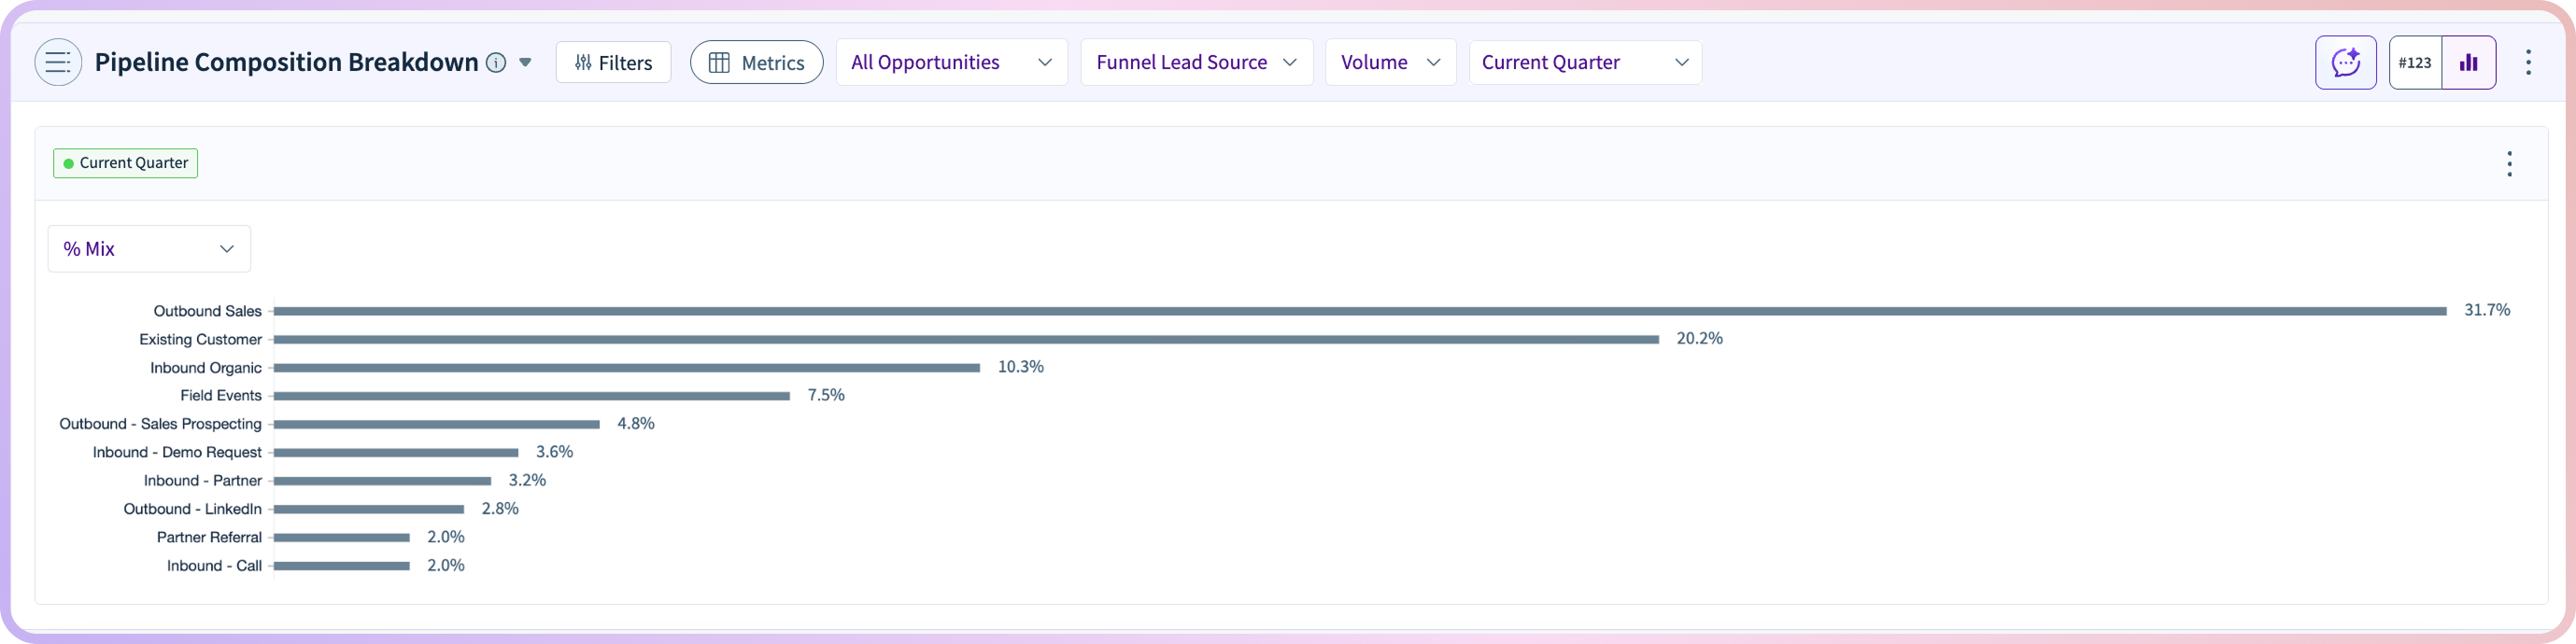
At the core of the dashboard is a clear view of pipeline coverage and how opportunities are distributed across stages. This helps teams understand whether there is enough pipeline to meet revenue goals and whether it is balanced across early, mid, and late funnel stages.
Teams can quickly identify gaps in pipeline value, uneven stage distribution, or over-reliance on a small set of late-stage deals. This visibility allows leaders to take early action to improve coverage and reduce forecast risk.
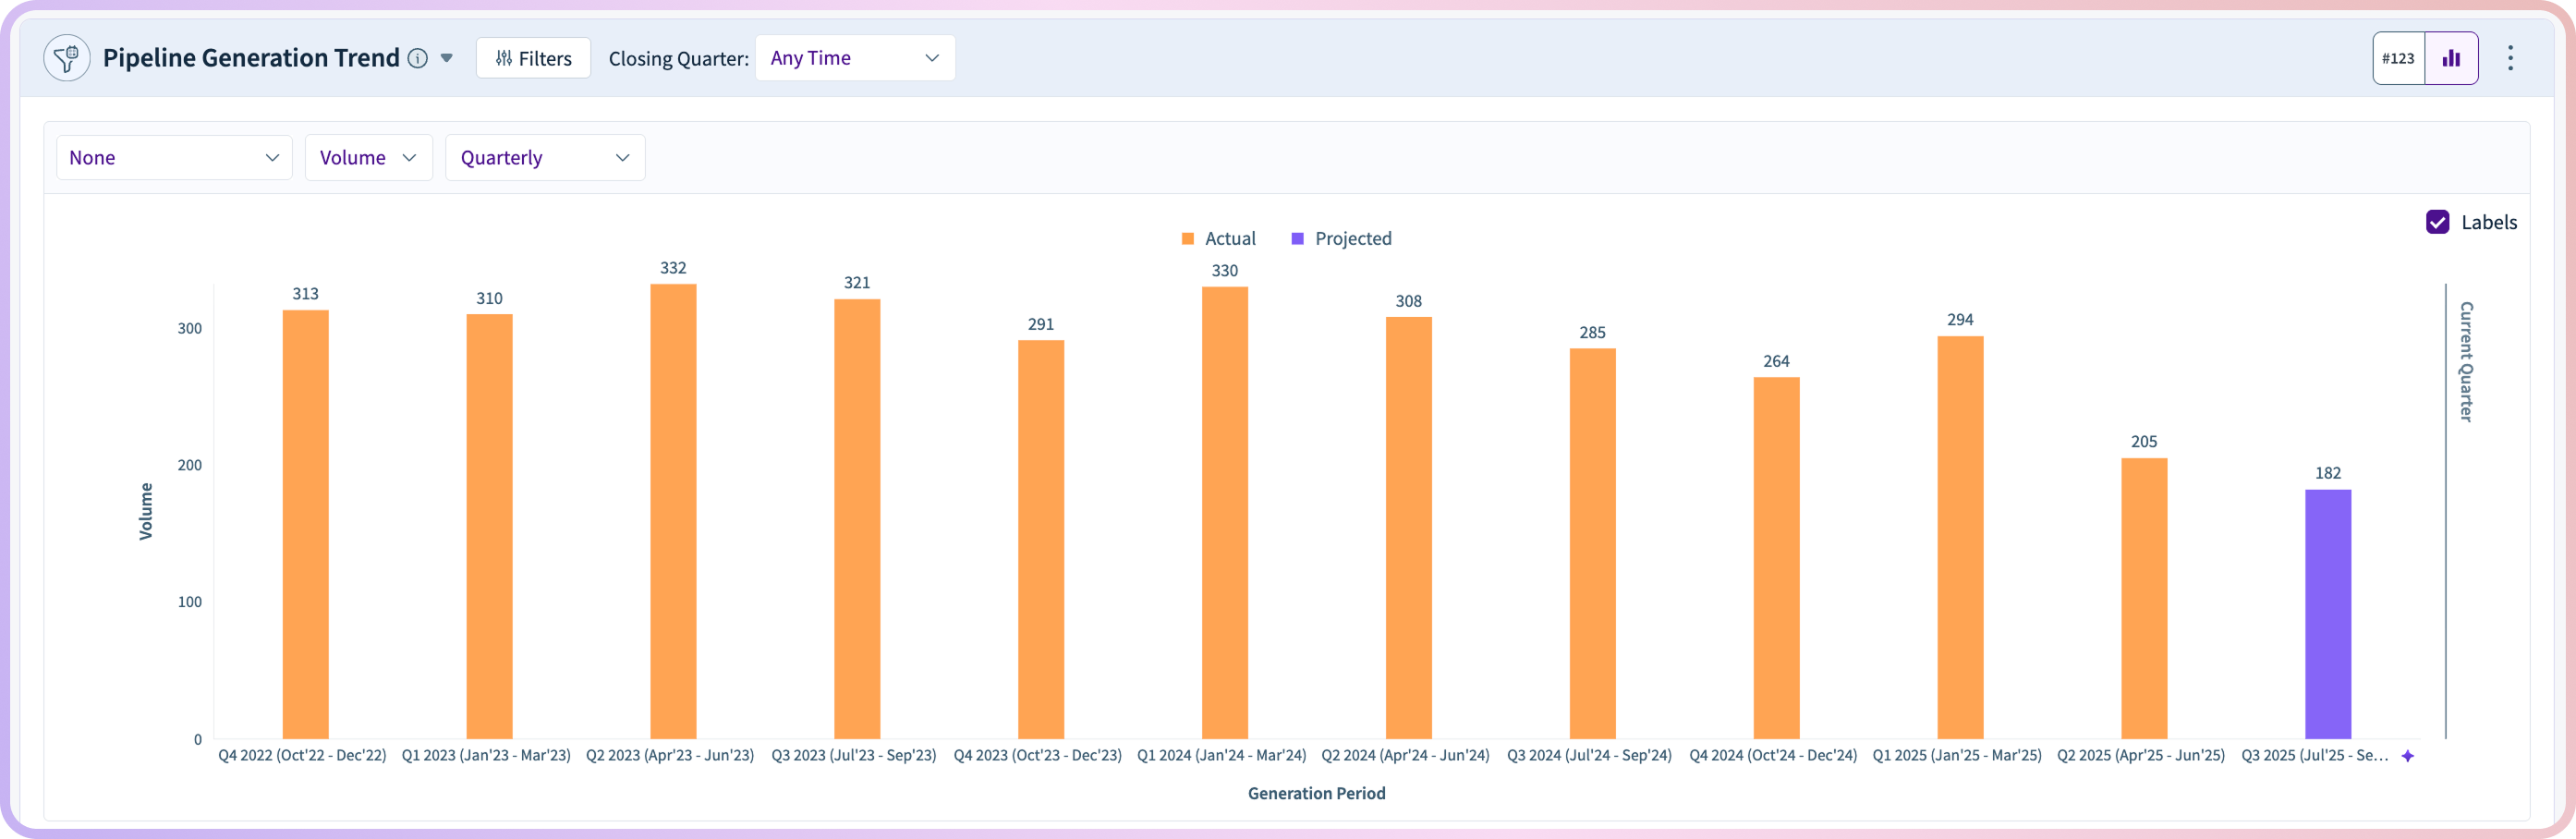
The dashboard tracks how pipeline is created over time, providing visibility into growth patterns and alignment with revenue targets. By analyzing generation trends across periods, teams can understand whether pipeline creation is keeping pace with business goals.
Key insights include:
These insights help teams adjust marketing and outbound efforts before gaps impact revenue outcomes.
Pipeline size alone is not enough. The dashboard measures how efficiently opportunities move through the funnel and how long it takes to convert them into revenue.
This includes visibility into stage-to-stage conversion rates, average time spent in each stage, and overall sales cycle length. By identifying where deals slow down or drop off, teams can address qualification gaps, improve follow-up, and optimize the sales process.
Understanding velocity and conversion efficiency helps ensure that pipeline not only exists but also converts at the expected rate.
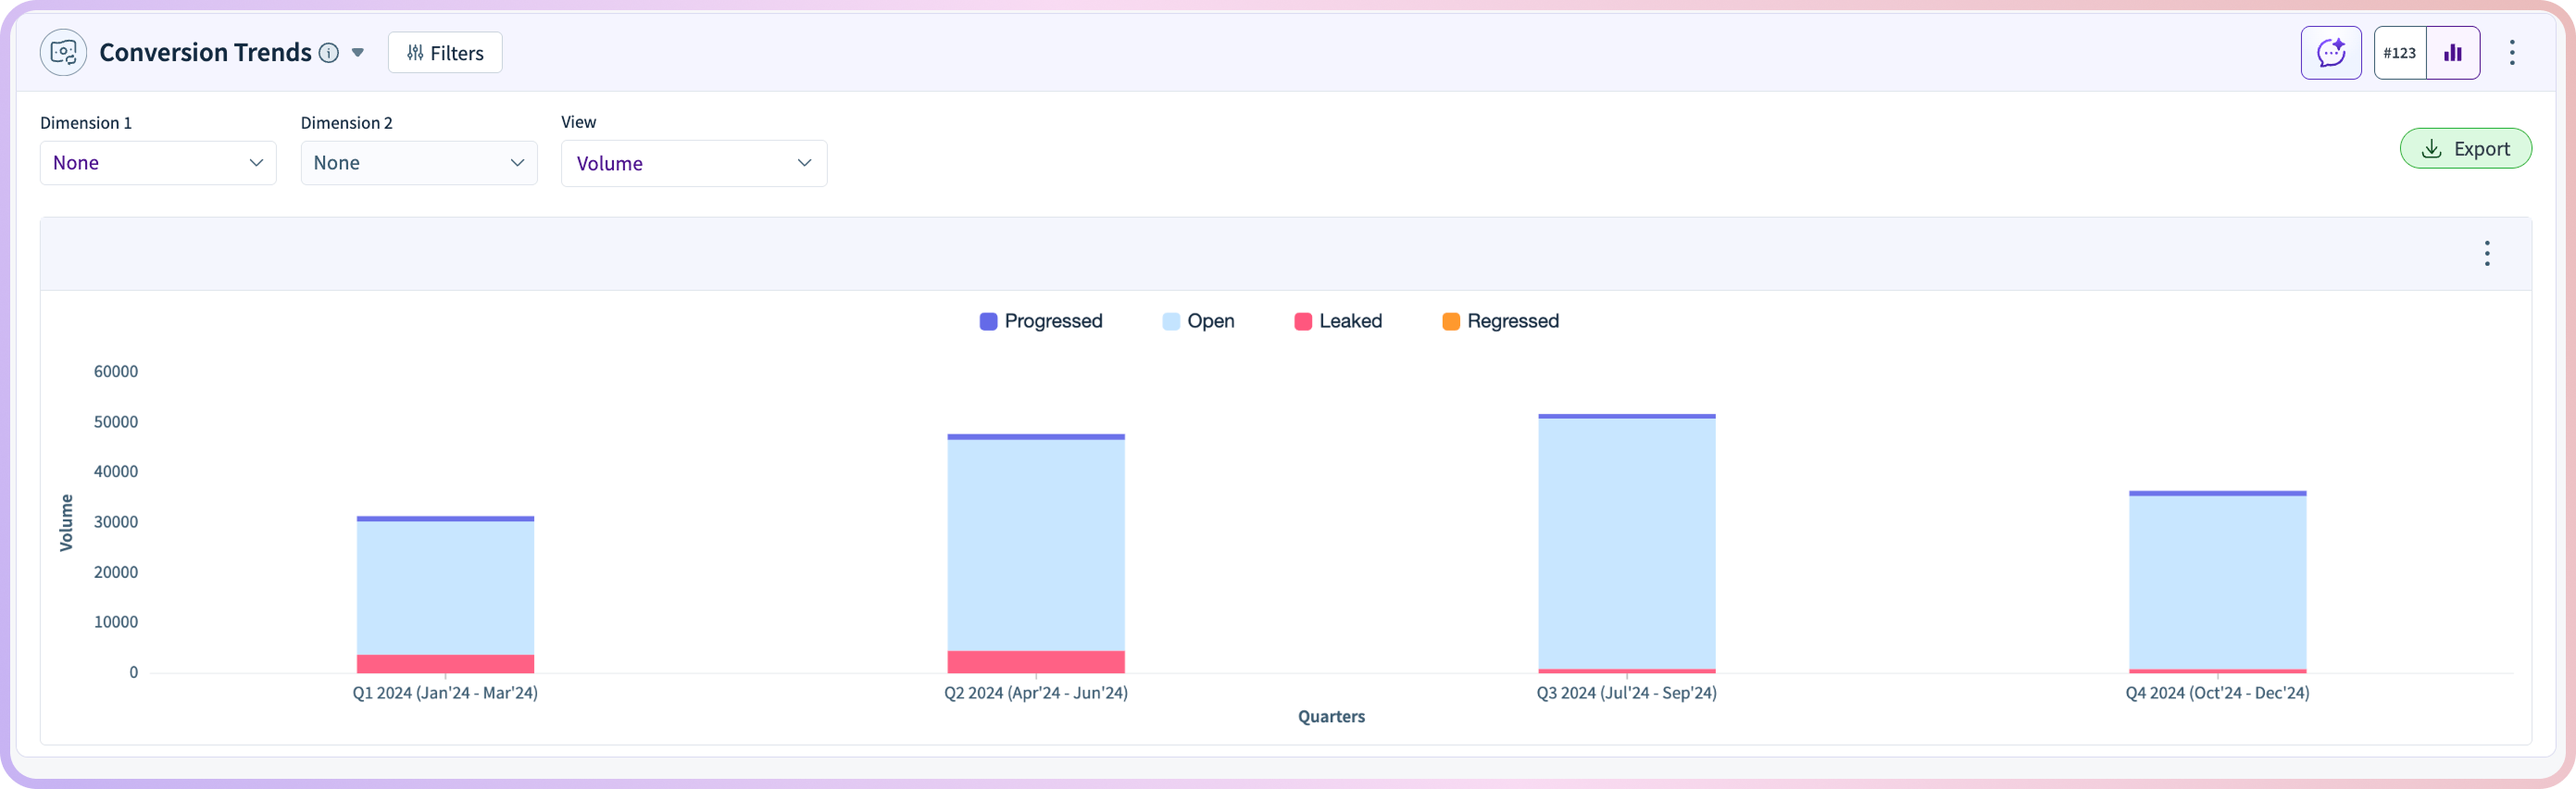
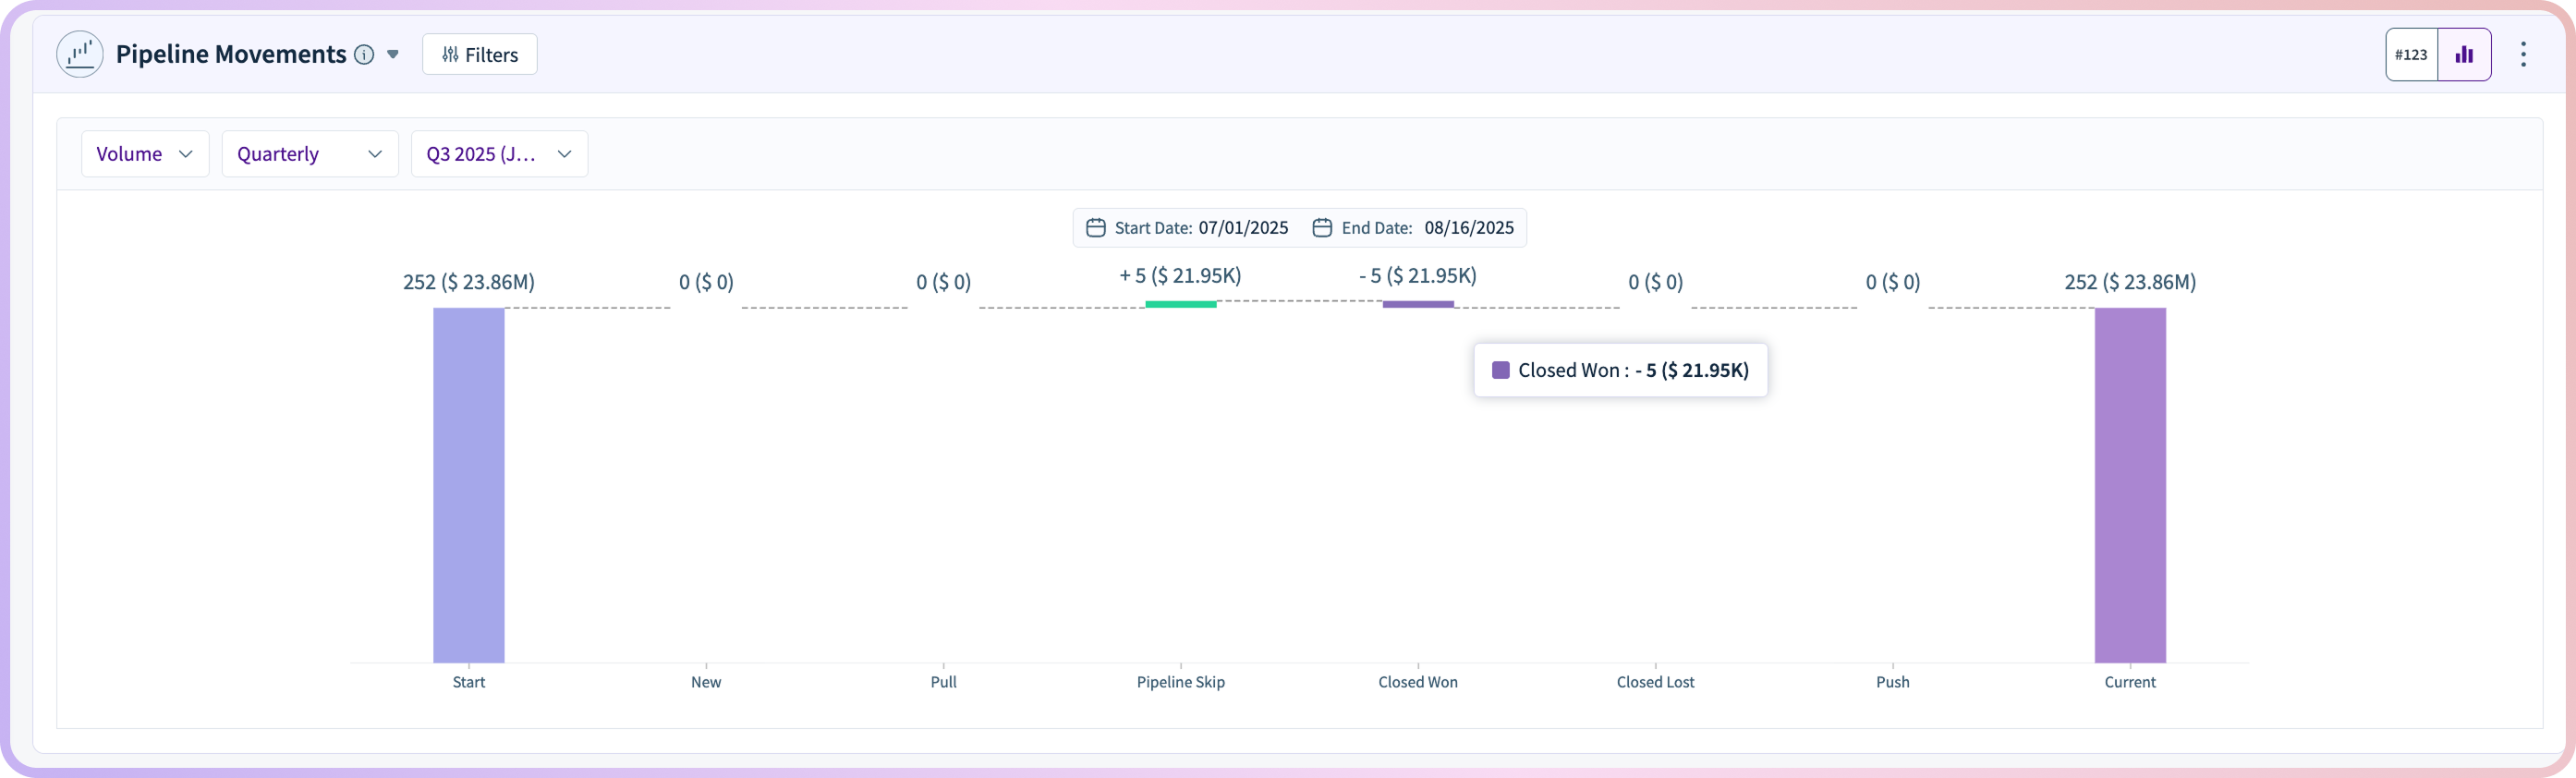
Beyond static pipeline snapshots, the dashboard provides a dynamic view of how pipeline is changing over time. It tracks inflows from new opportunities, progression across stages, and losses due to closed-lost deals.
This movement-based perspective helps teams understand whether pipeline is growing, shrinking, or stagnating. It also highlights where deals are getting stuck and where momentum is building.
By focusing on movement rather than just size, teams gain a more accurate view of pipeline health.
The Pipeline Health Dashboard Template transforms pipeline reporting into a proactive revenue management tool. By combining coverage, generation, conversion, and movement into a single view, it enables teams to maintain control over pipeline performance.
Marketing ensures consistent demand generation. Sales focuses on progressing the right opportunities. RevOps identifies risks early. Leadership gains confidence in forecast accuracy and revenue predictability.
Next step: If you’re using RevSure, launch the Pipeline Health Dashboard Template to maintain real-time visibility into pipeline performance. If not, book a demo to see how RevSure turns pipeline data into predictable revenue outcomes.
What is a pipeline health dashboard?
A pipeline health dashboard provides a unified view of pipeline coverage, stage distribution, conversion efficiency, and deal velocity to assess whether pipeline can support revenue goals.
How do you measure pipeline health?
Pipeline health is measured through coverage ratios, stage balance, conversion rates, deal velocity, and pipeline generation trends over time.
Why is pipeline health difficult to assess?
Pipeline data is often fragmented across marketing, sales, and RevOps systems, making it hard to get a complete, real-time view of coverage and progression.
What insights does this dashboard provide?
It highlights pipeline coverage, stage balance, generation trends, conversion efficiency, deal velocity, and overall pipeline movement.
How does this dashboard track pipeline coverage?
It compares total pipeline value against revenue targets and shows how opportunities are distributed across funnel stages.
Who should use a pipeline health dashboard?
GTM leaders, sales teams, RevOps, marketing teams, and executives use it to monitor pipeline performance and ensure alignment with revenue goals.
What is pipeline coverage and why does it matter?
Pipeline coverage measures whether there is enough pipeline to meet revenue targets, helping teams identify gaps and reduce forecast risk.
Can this dashboard identify pipeline risks early?
Yes. It surfaces issues like low coverage, uneven stage distribution, slow deal velocity, and weak conversion rates before they impact revenue.
How is this different from pipeline reports or CRM dashboards?
Traditional reports provide static snapshots, while this dashboard offers a dynamic, full-funnel view of pipeline strength, movement, and efficiency.
What metrics are most important for pipeline health?
Key metrics include pipeline coverage ratio, stage distribution, pipeline generation rate, conversion rates, deal velocity, and win/loss trends.