Event Effectiveness Dashboard Template | Event ROI & Pipeline Attribution
Understand how events drive pipeline creation, influence deals, and impact revenue
Events are one of the most resource-intensive marketing investments, yet their impact is often difficult to measure. Marketing teams track attendance and engagement, sales focuses on follow-ups, and RevOps manages attribution separately. As a result, leadership sees pipeline outcomes but lacks clarity on which events actually contributed to revenue.
RevSure’s Event Effectiveness Dashboard Template brings all event performance data into a unified view. It connects event participation to pipeline creation, opportunity influence, and revenue outcomes, giving teams a clear understanding of what’s working and where to invest.
Built for Field Marketing, Demand Gen, and Revenue Teams
This template is designed for B2B organizations running a mix of in-person events, trade shows, executive dinners, webinars, and multi-touch campaigns. Field marketing managers, demand generation teams, RevOps, and executive leaders use it to evaluate event impact beyond attendance metrics.
By aligning event performance with pipeline and revenue, teams can move from activity tracking to strategic decision-making. Instead of asking how many people attended, they can focus on which events generated meaningful pipeline and influenced deals.
Attributed Performance to Pipeline
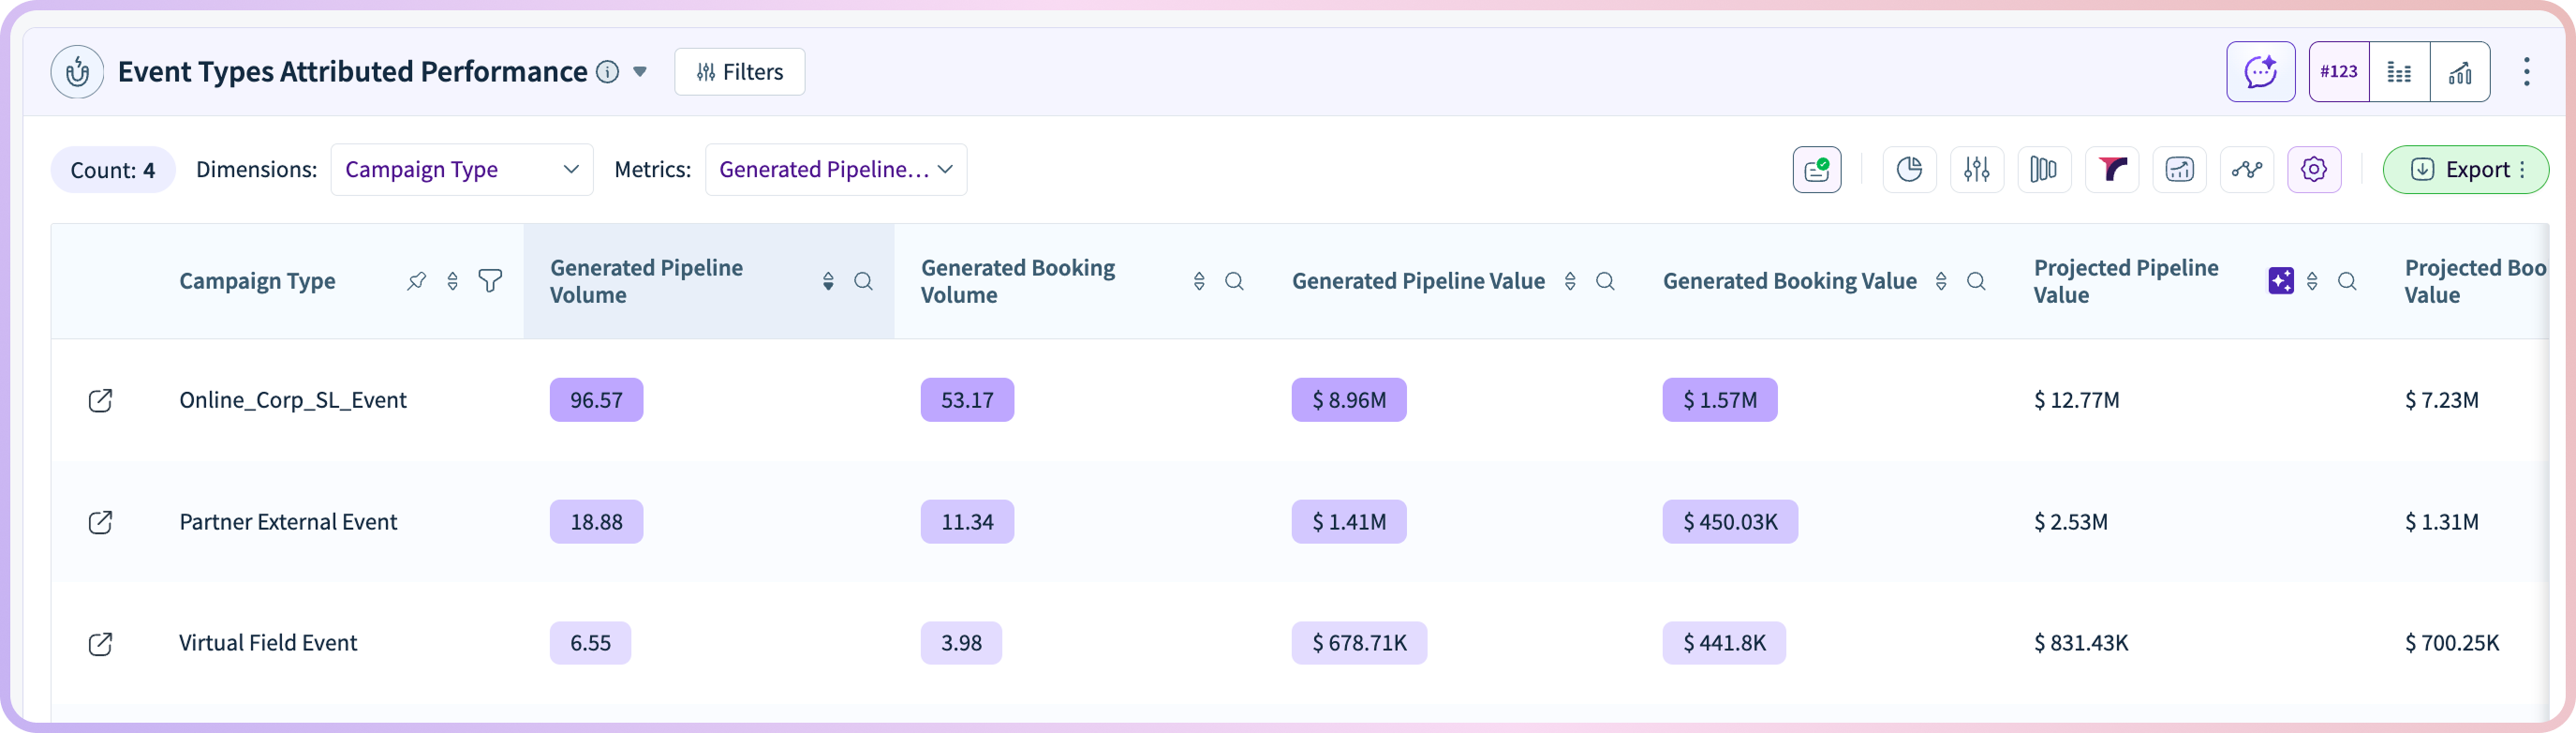
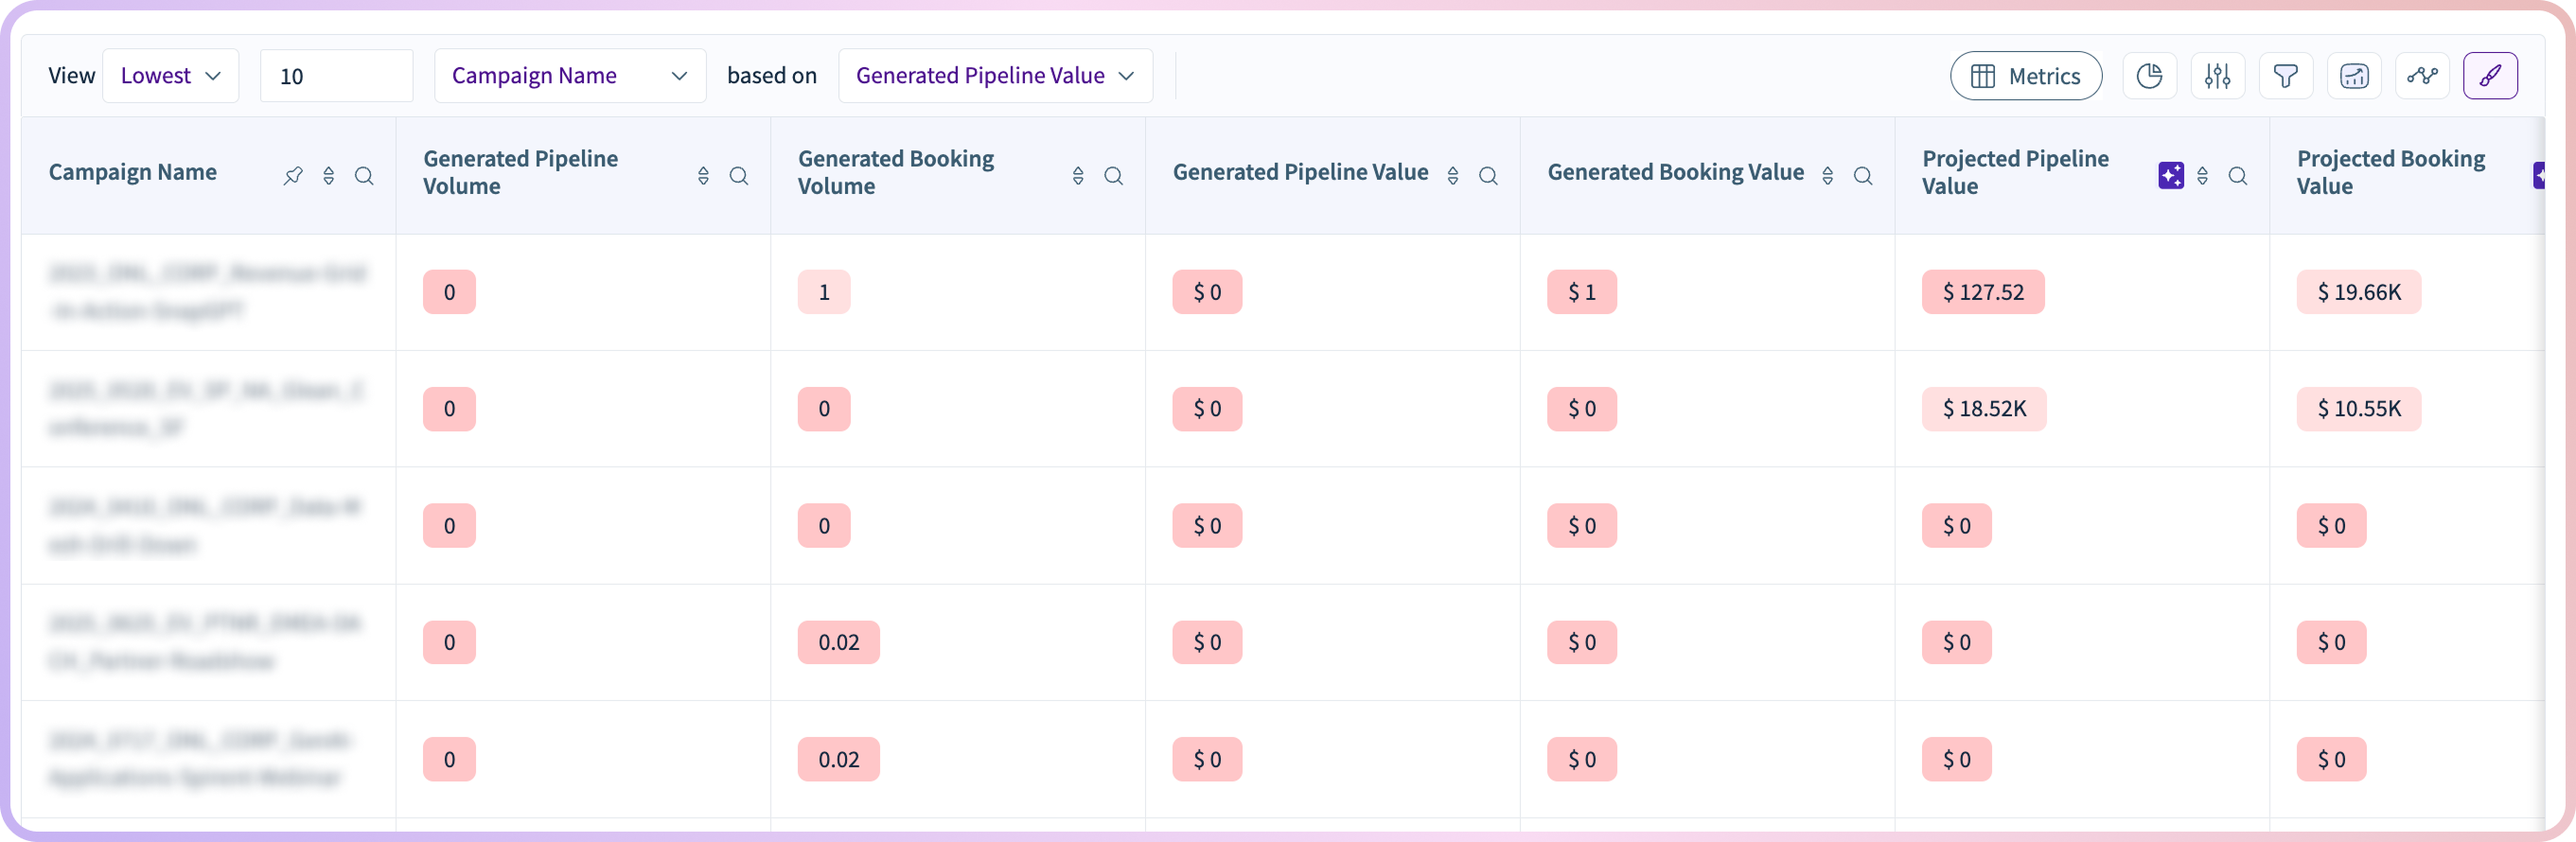
At the core of the dashboard is a clear view of how events contribute to pipeline generation and revenue outcomes. Using consistent attribution models, the template highlights the relationship between event participation and downstream impact.
Teams can understand how much pipeline is created from event-sourced opportunities, how much revenue is influenced by event engagement, and how conversion rates vary across event types. This ensures clarity on whether events are generating new demand or strengthening existing opportunities.
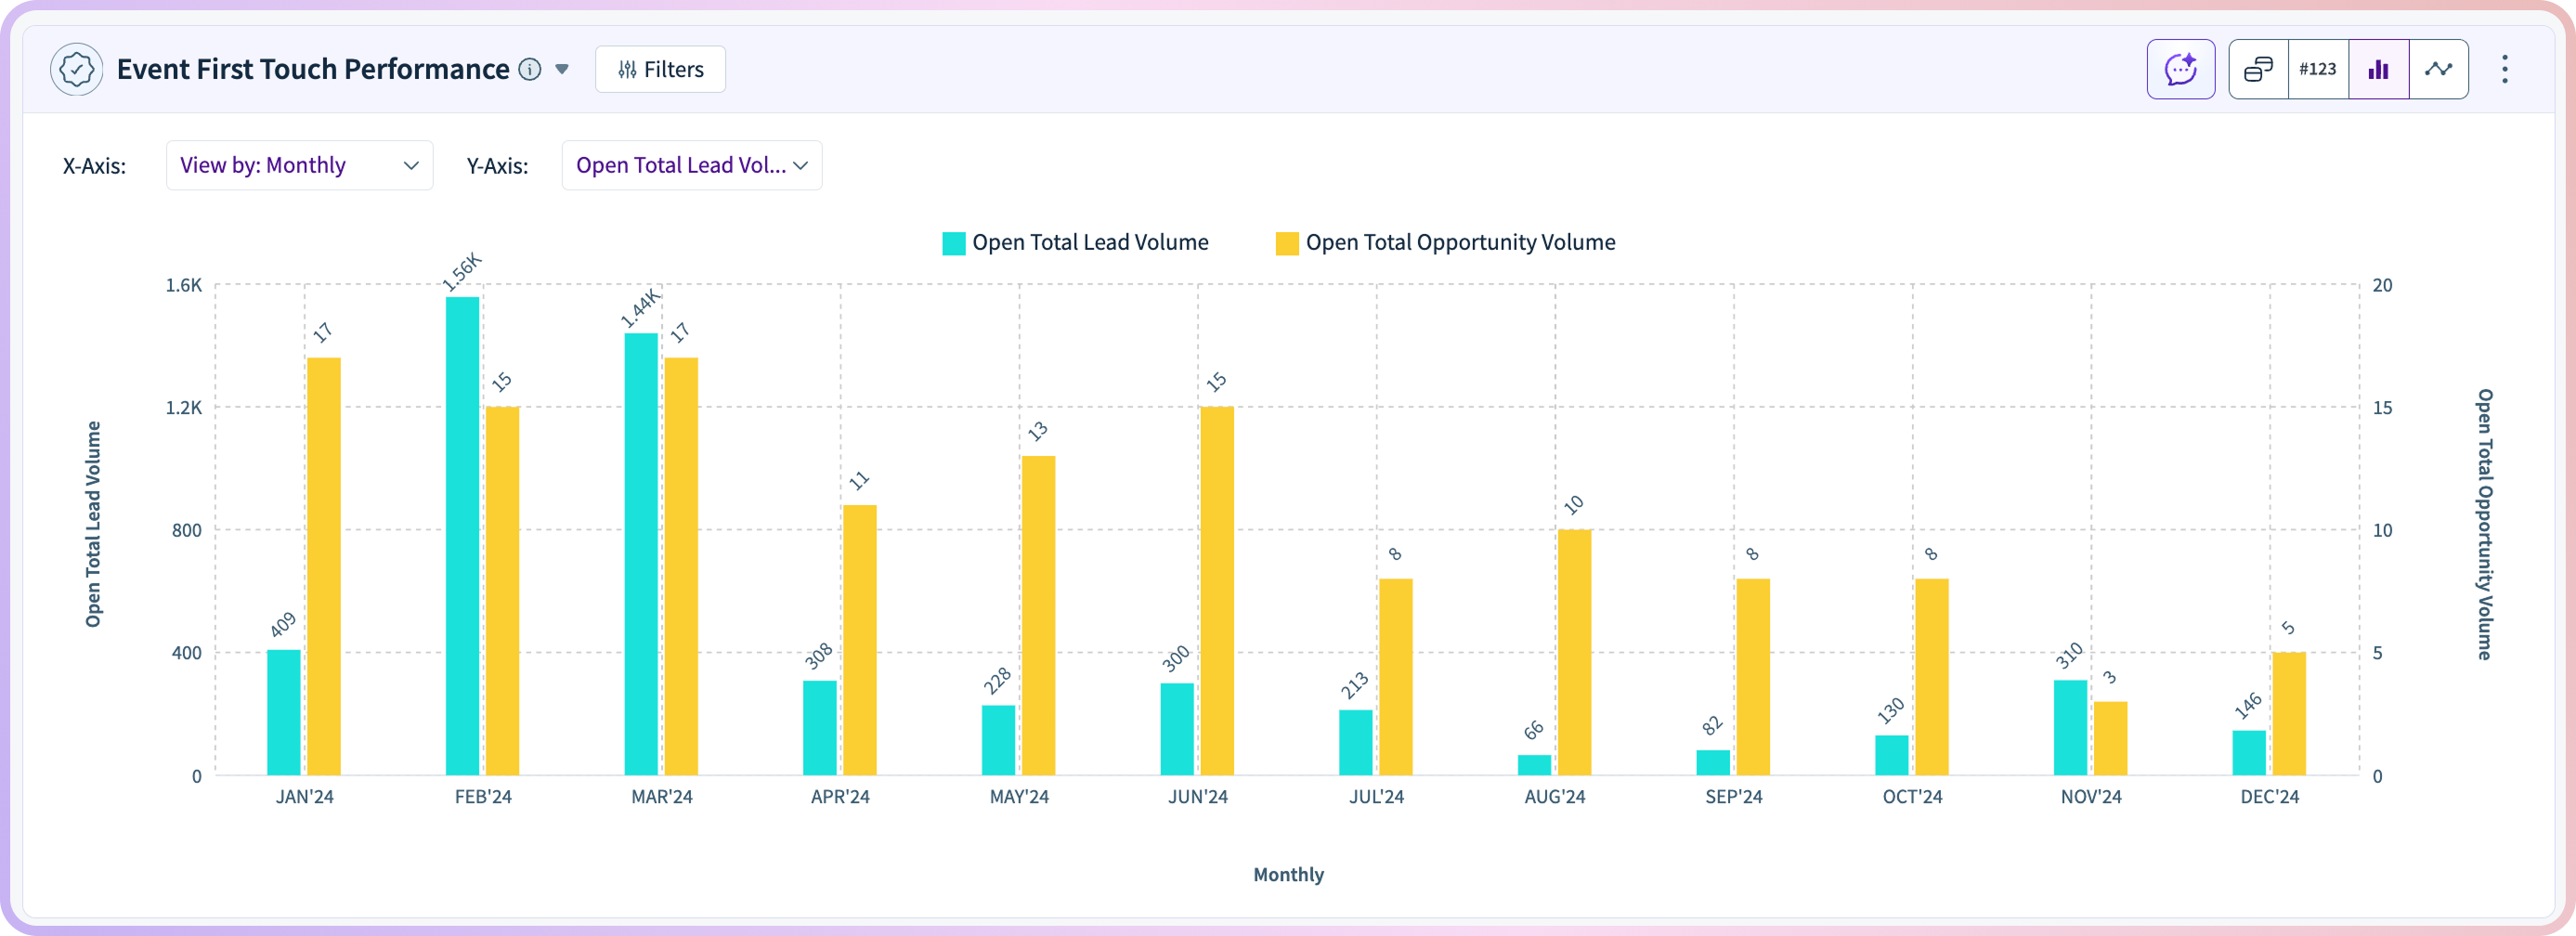
Event Sourcing and First-Touch Impact
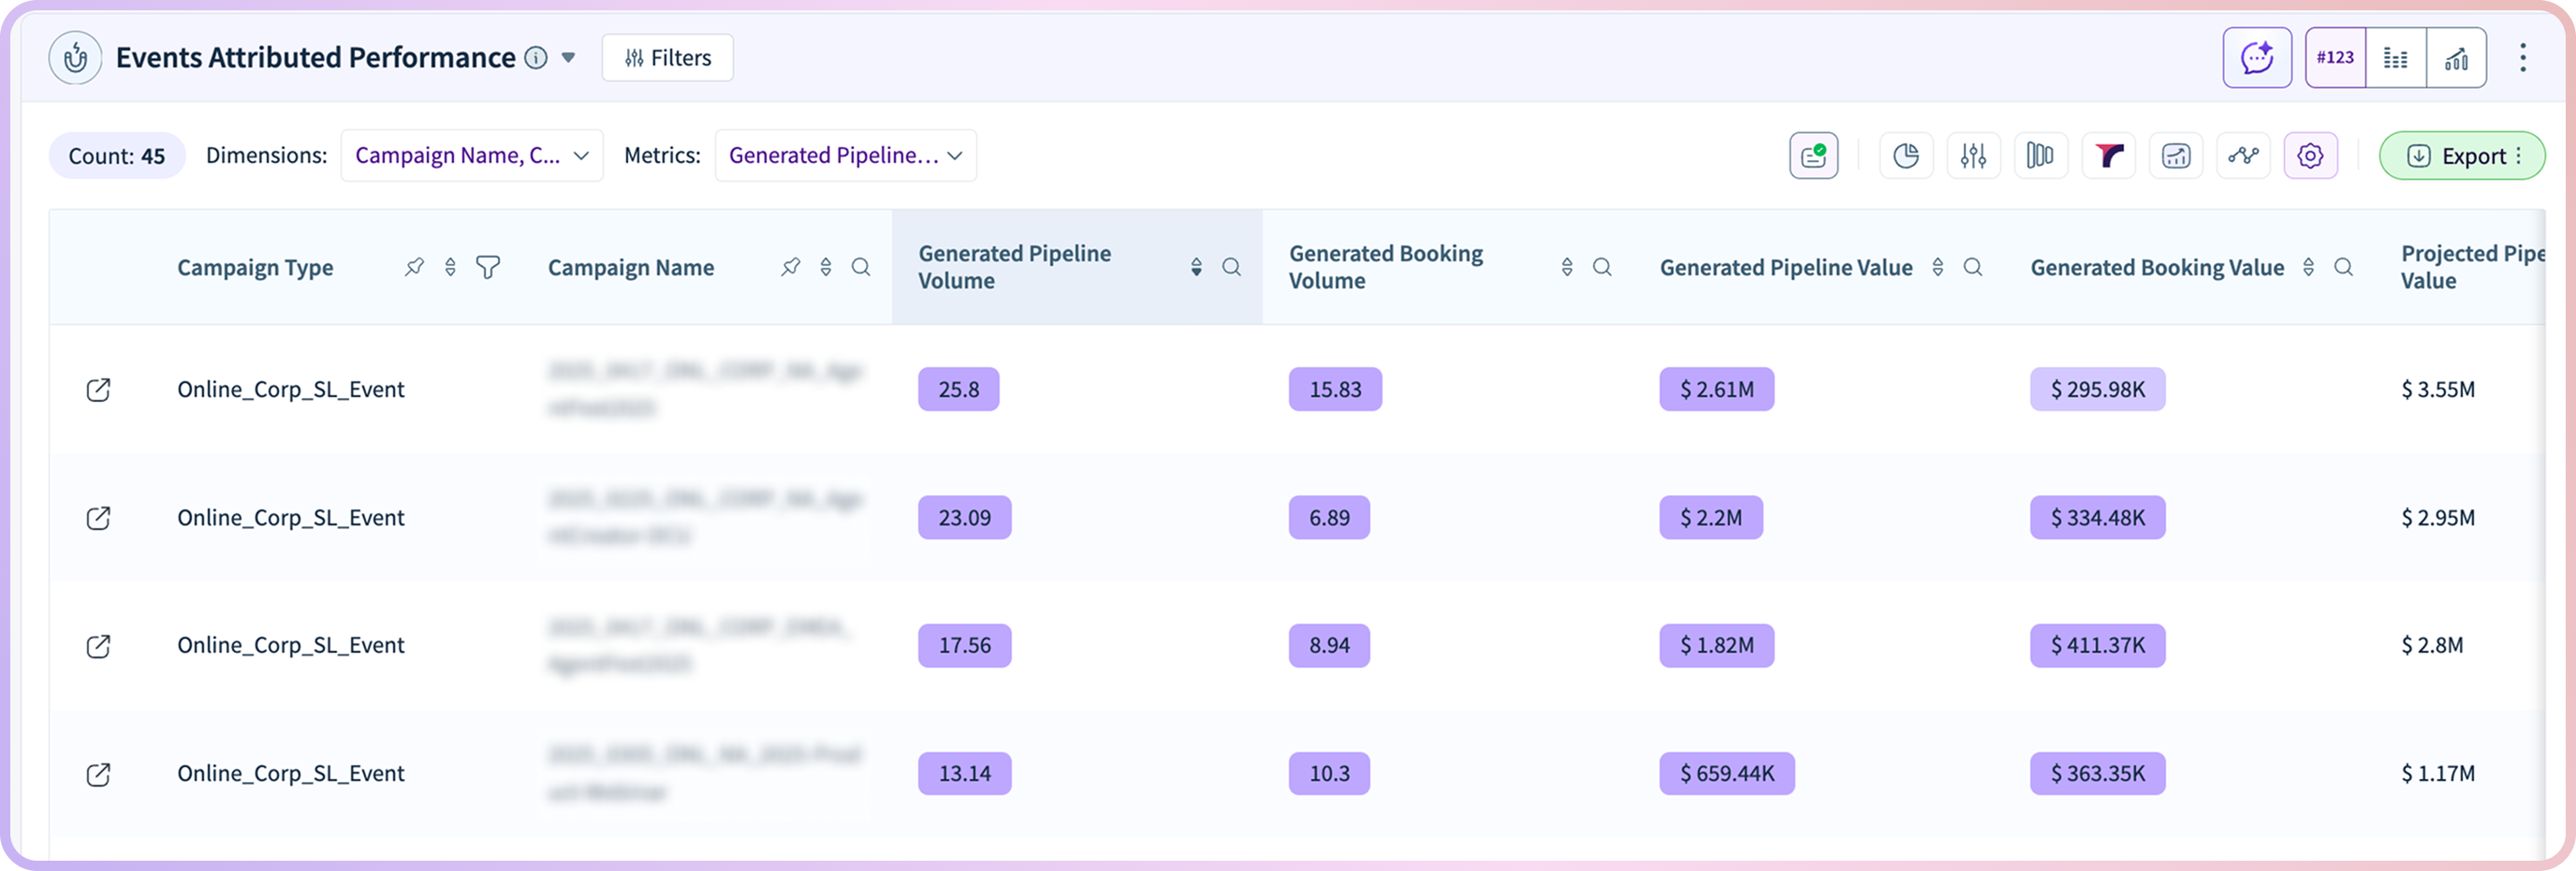
Not all events serve the same role in the buyer journey. Some generate new opportunities, while others support progression later in the funnel. The dashboard separates these contributions to show which events act as primary sourcing channels.
This view helps teams evaluate which events drive net-new pipeline, how efficiently they convert leads into opportunities, and how cost aligns with outcomes. By understanding sourcing performance, marketing teams can prioritize events that consistently generate high-quality opportunities.
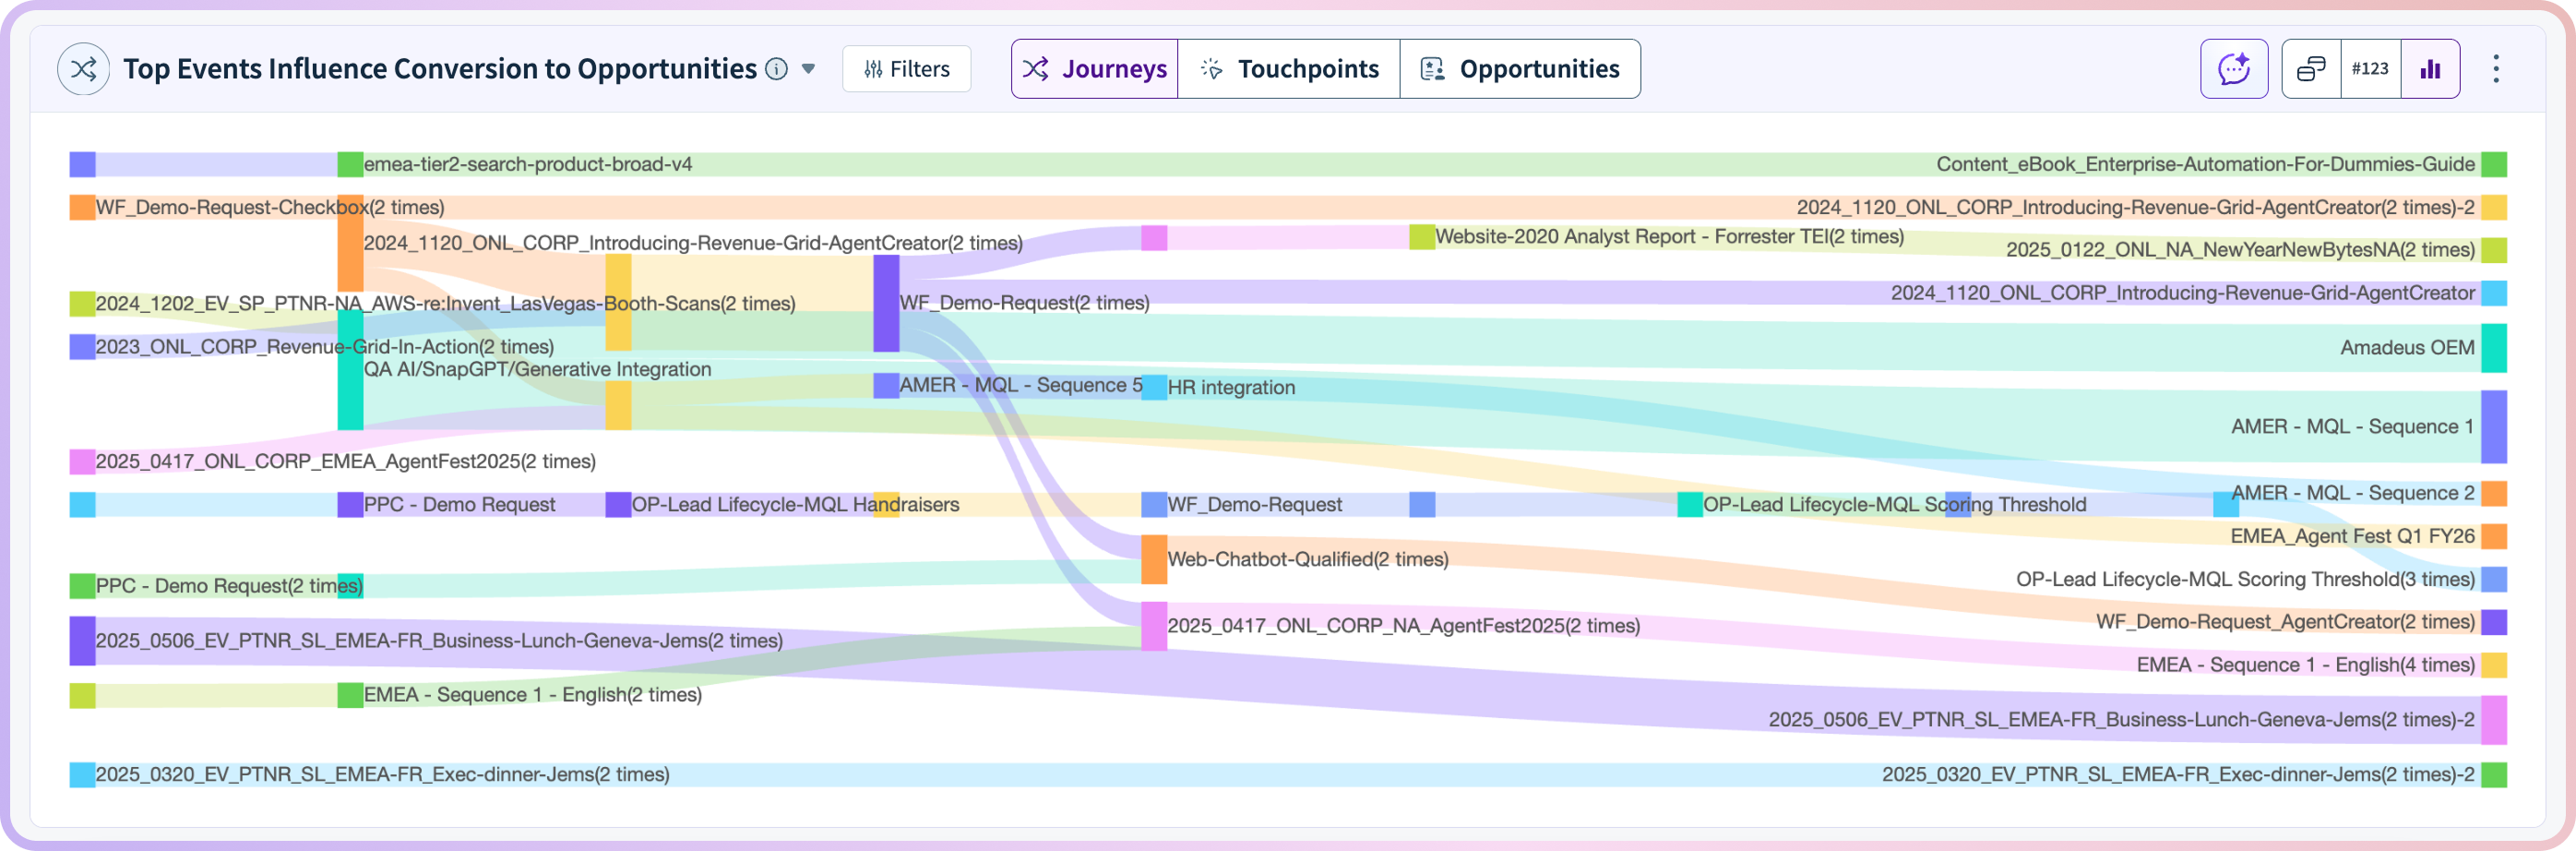
Event Influence Across the Buyer Journey
Many events play a critical role after the initial touchpoint, influencing deal progression and accelerating movement through the funnel. The dashboard maps event participation across buyer journeys, revealing how events contribute at different stages.
Teams can see whether events help advance late-stage deals, strengthen mid-funnel engagement, or improve stage-to-stage conversion rates. This insight allows teams to better time events and target accounts based on where they are in the buying journey.
Identifying High- and Low-Performing Events
The template surfaces both top-performing and underperforming events based on pipeline contribution, conversion performance, and revenue impact. High-performing events can be scaled or replicated, while underperforming programs can be refined or deprioritized.
This balanced view ensures that teams are not relying on anecdotal feedback or attendance metrics alone. Instead, decisions are based on measurable pipeline and revenue outcomes, enabling more efficient allocation of budget and resources.

From Event Activity to Revenue Accountability
The Event Effectiveness Dashboard Template transforms how teams evaluate event performance. By connecting attendance, engagement, pipeline creation, and revenue into one view, it replaces fragmented reporting with a consistent framework for measuring impact.
Marketing gains clarity on ROI. Sales gains visibility into high-intent accounts. RevOps maintains consistent attribution. Leadership gains confidence in event investment decisions.
Next step: If you’re using RevSure, launch the Event Effectiveness Dashboard Template to measure event ROI with precision. If not, book a demo to see how RevSure connects event activity directly to pipeline and revenue impact.
Frequently Asked Questions
What is an event effectiveness dashboard?
An event effectiveness dashboard shows how events contribute to pipeline creation, deal progression, and revenue by connecting participation to business outcomes.
How do you measure event effectiveness in B2B marketing?
Event effectiveness is measured through metrics like pipeline generated, revenue influenced, conversion rates, and the role events play across the buyer journey.
Why is event ROI difficult to measure?
Events influence both new pipeline and existing deals across multiple touchpoints, making it hard to attribute impact using traditional, single-touch models.
What insights does this dashboard provide?
It reveals event-sourced pipeline, influenced revenue, conversion performance, and how events contribute across different stages of the funnel.
How does this dashboard track event ROI?
It connects event participation data with pipeline creation, opportunity progression, and closed revenue using consistent attribution models.
Who should use an event effectiveness dashboard?
Field marketing teams, demand generation leaders, RevOps, sales teams, and executives use it to evaluate and optimize event investments.
What is the difference between event sourcing and event influence?
Event sourcing refers to pipeline directly created from events, while event influence measures how events impact existing opportunities and deal progression.
Can this template identify high-performing events?
Yes. It highlights events that generate strong pipeline, high conversion rates, and meaningful revenue impact, as well as underperforming ones.
How does it help optimize event strategy?
By showing which events drive pipeline and accelerate deals, teams can prioritize high-impact formats, improve targeting, and allocate budget more effectively.
What metrics matter most for event performance?
Key metrics include pipeline sourced, revenue influenced, cost per opportunity, conversion rates, deal acceleration, and overall event ROI.