Paid Marketing Effectiveness Dashboard Template | ROI, Pipeline & Campaign Performance
Understand how paid campaigns drive pipeline, revenue, and conversion efficiency
Paid marketing is often measured through clicks, impressions, and cost per lead, but these metrics rarely reflect true business impact. Marketing teams see platform performance, sales sees opportunity flow, and RevOps tracks pipeline separately. This fragmented view makes it difficult to understand whether paid investment is actually driving revenue.
RevSure’s Paid Marketing Effectiveness Dashboard Template brings these signals together into a unified view. It connects campaign spend to pipeline generation, funnel progression, and revenue outcomes, helping teams understand which campaigns create real business impact and where budget should be optimized.
Built for Performance Marketing and Revenue Teams
This template is designed for B2B organizations running paid search, paid social, display, retargeting, ABM advertising, and multi-channel paid programs. Performance marketers, demand generation leaders, RevOps teams, and executive stakeholders use it to align spend with pipeline outcomes.
By connecting campaign performance to revenue impact, teams can move beyond platform-level reporting and focus on optimizing investments that drive measurable growth.
Campaign Performance and ROI Visibility
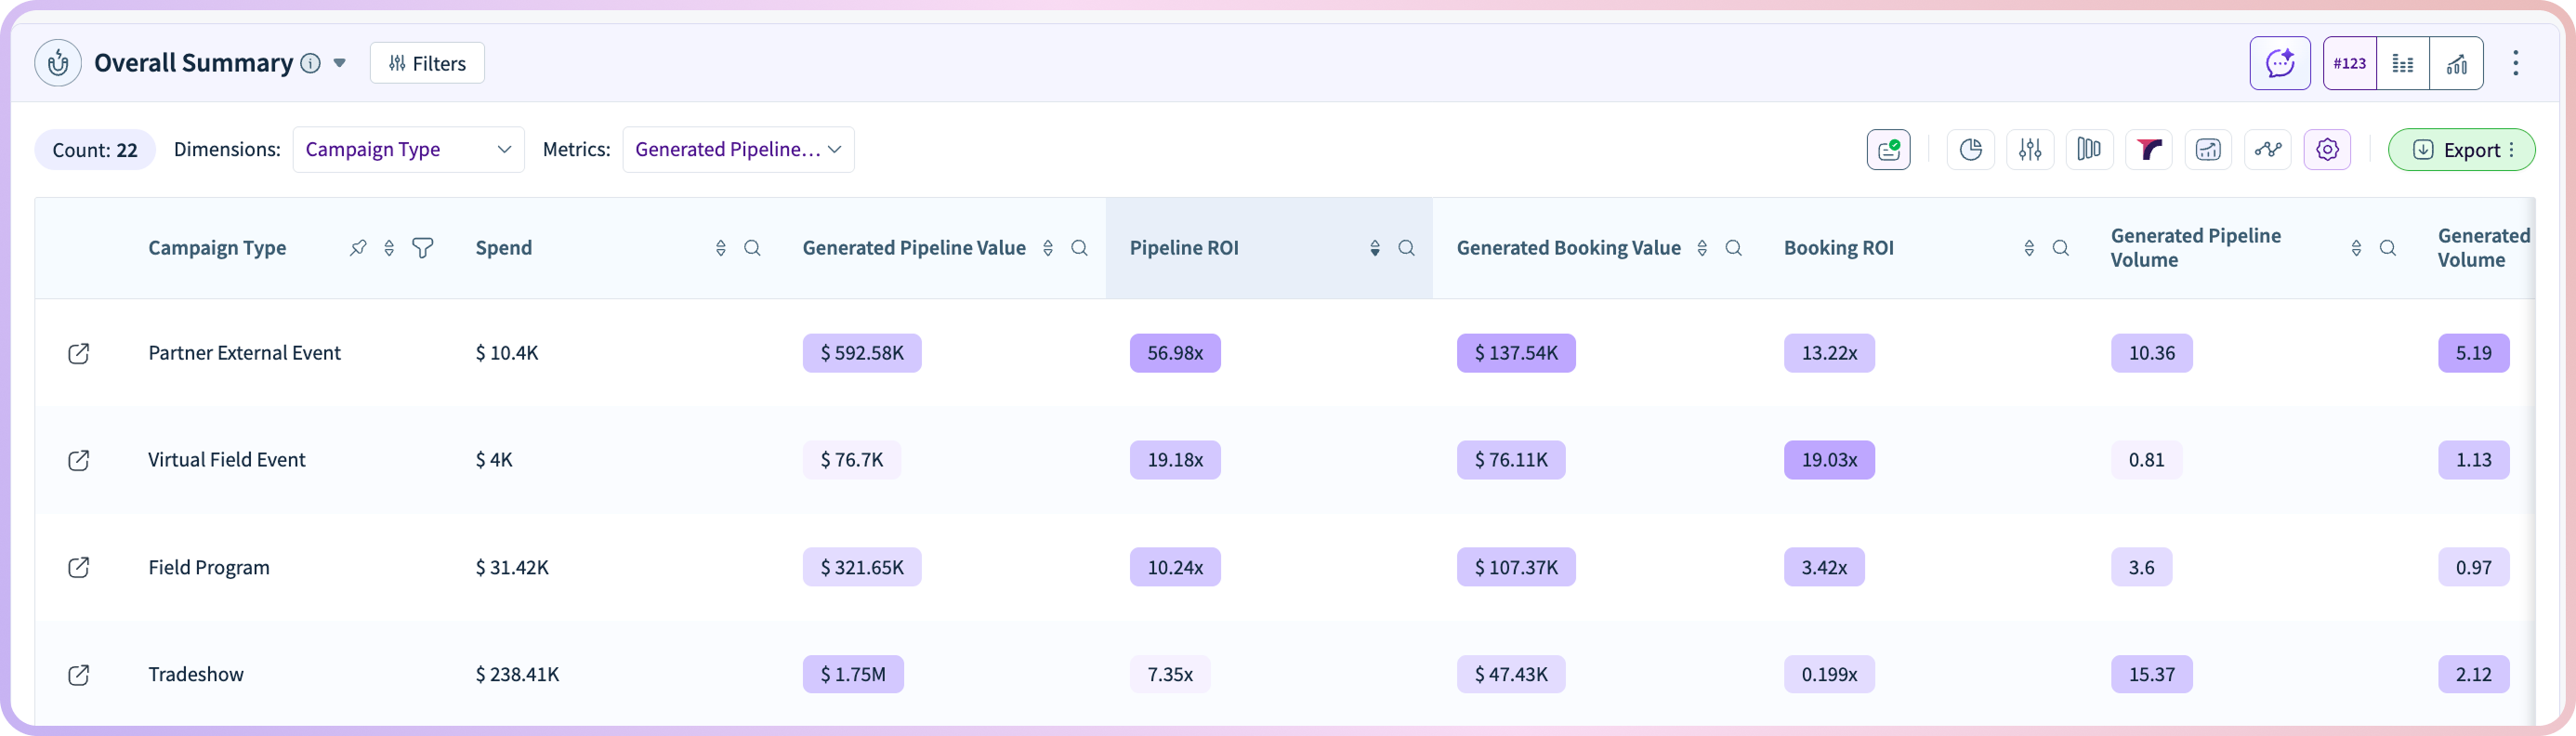
At the core of the dashboard is a unified view of campaign performance, combining spend, pipeline generated, influenced revenue, and ROI into a single perspective. This allows teams to evaluate how efficiently paid investment translates into pipeline and revenue outcomes.
Teams can quickly understand which campaigns generate meaningful pipeline, how effectively spend converts into revenue, and how performance compares across channels. Instead of analyzing fragmented platform metrics, they gain a clear view tied directly to business results.
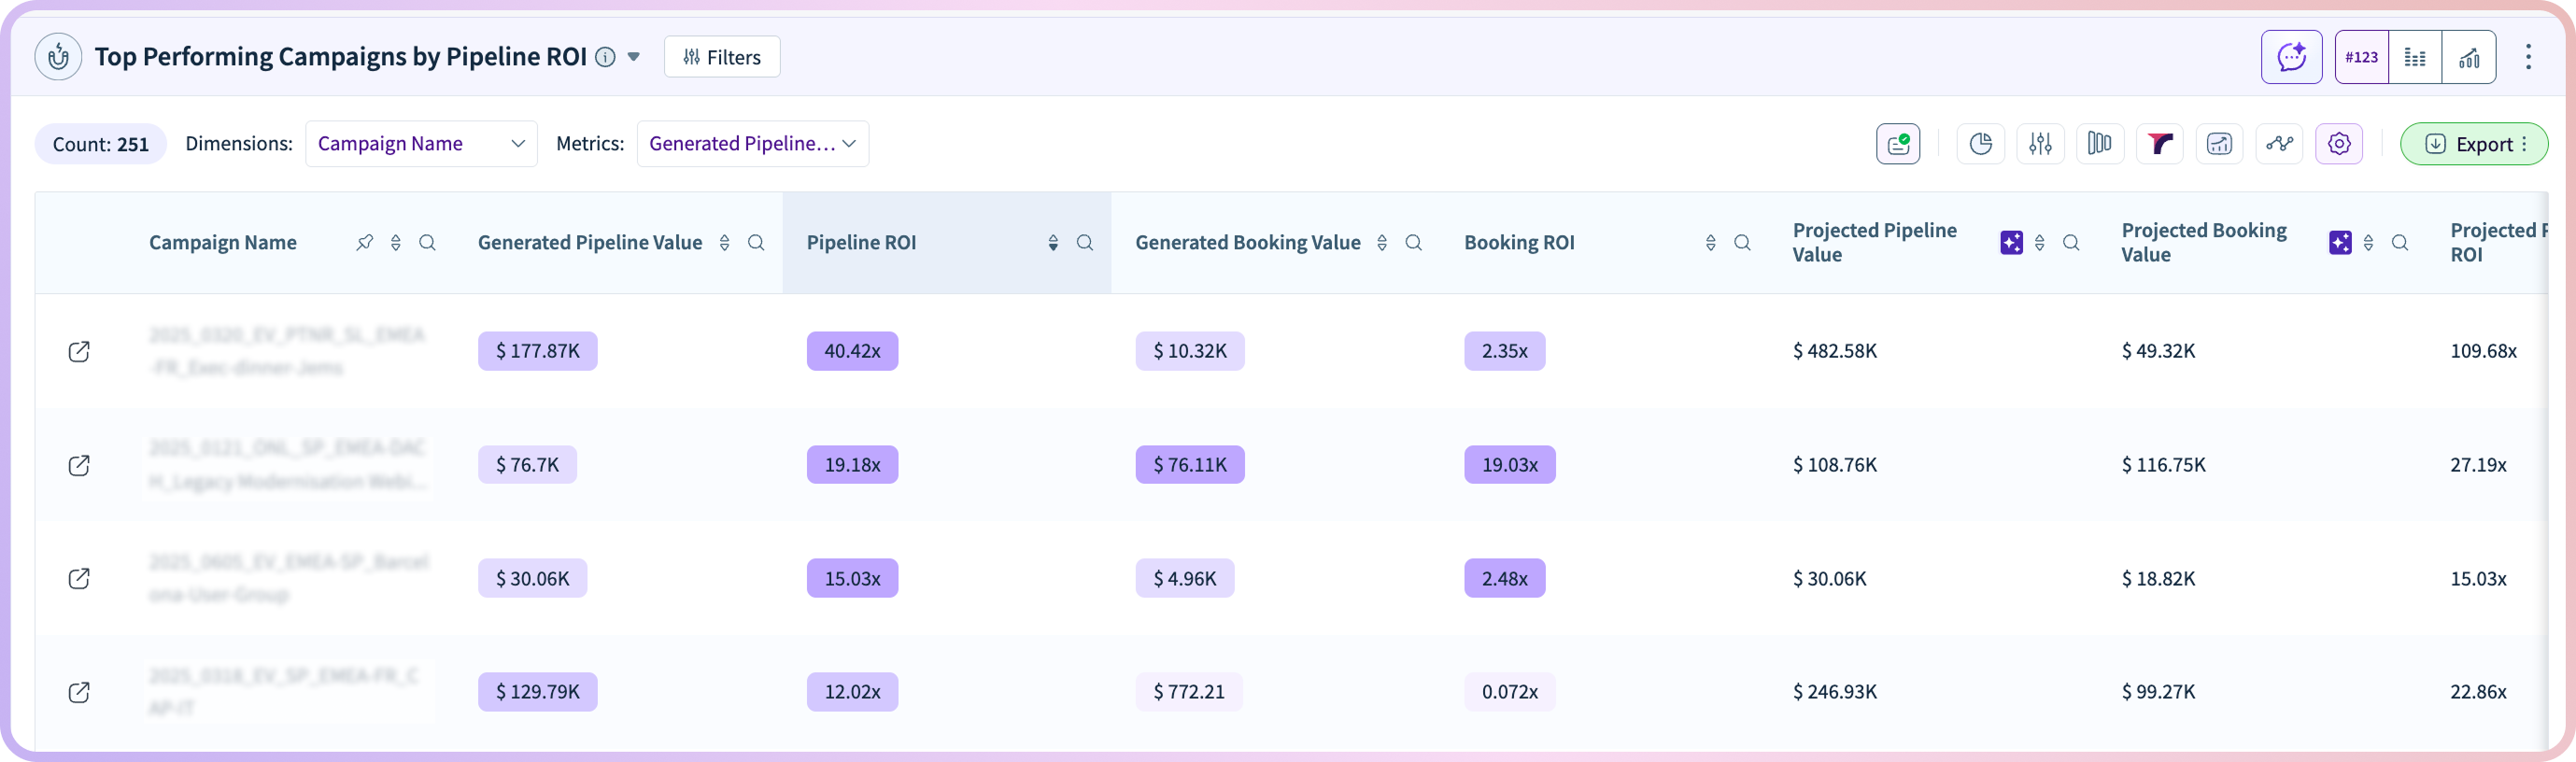
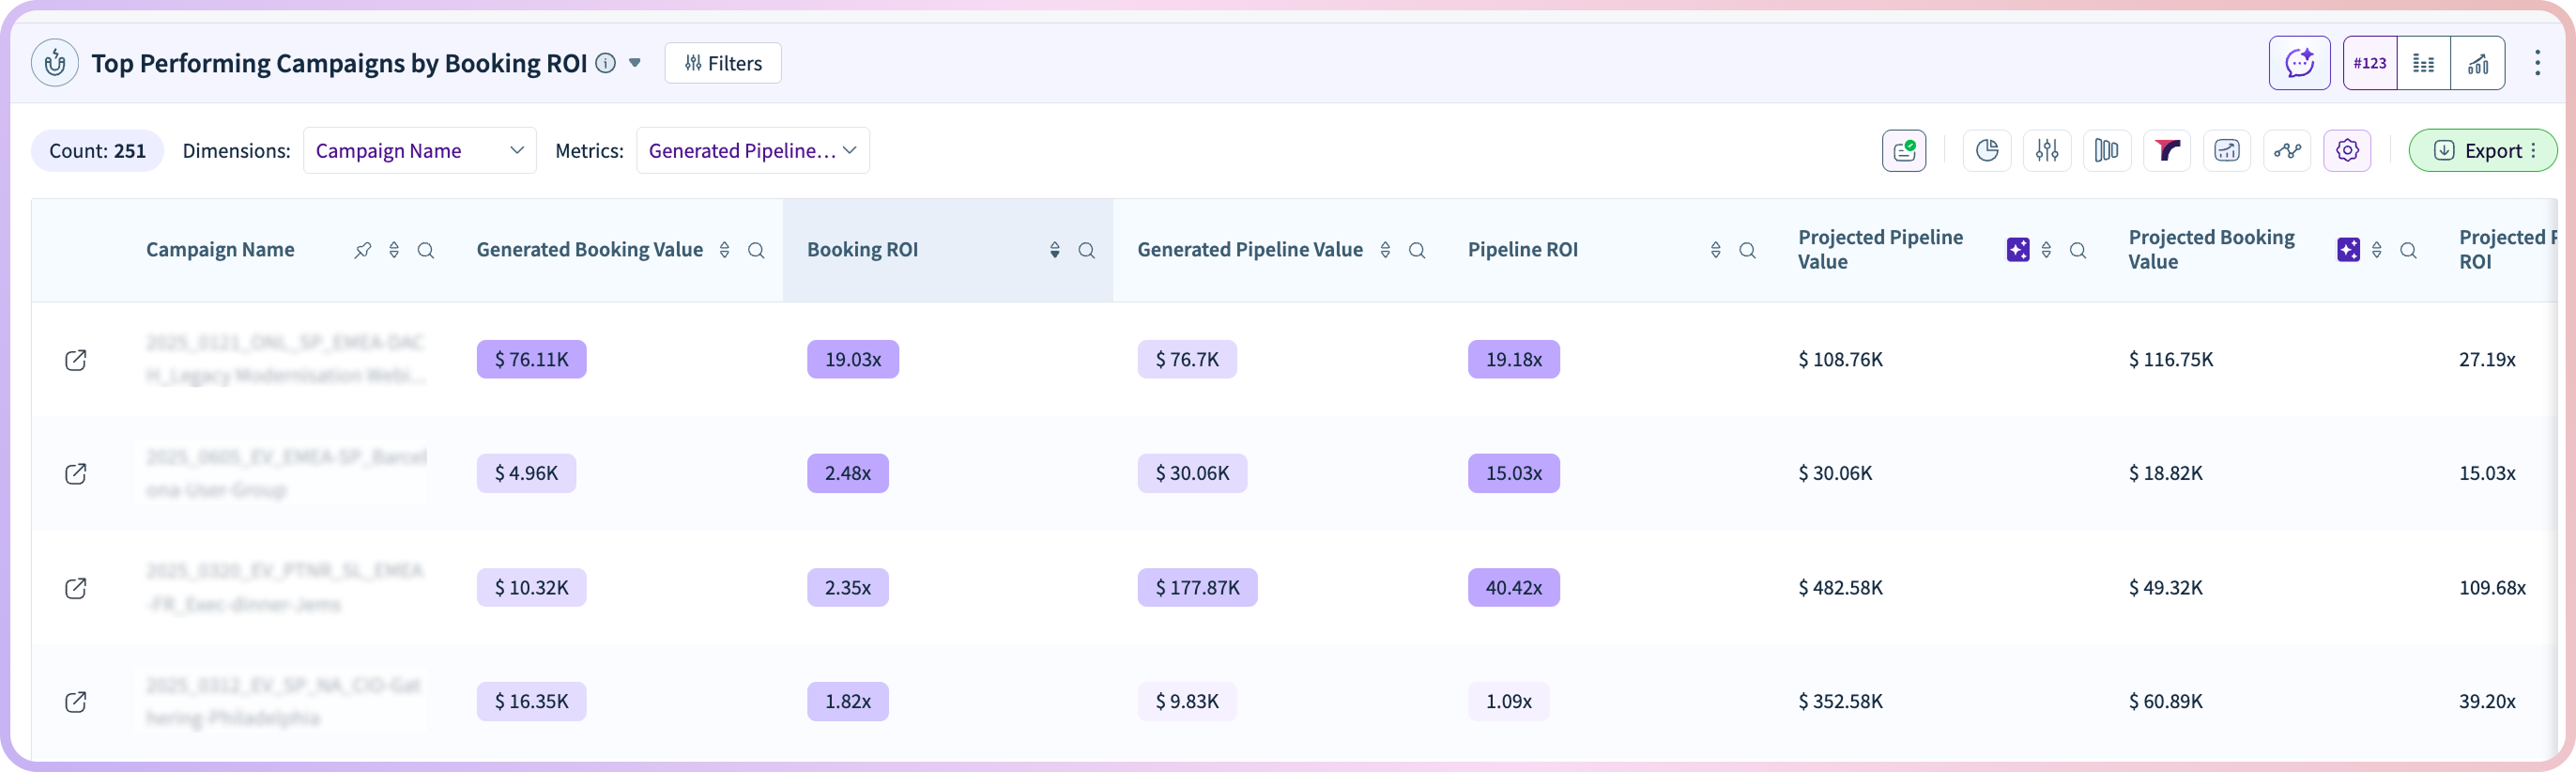
Identifying High-Performing Campaigns
The template highlights campaigns that deliver the strongest pipeline contribution and return on investment. These insights help teams identify which programs consistently generate high-value opportunities and strong conversion performance across the funnel.
By focusing on campaigns that drive both volume and quality, teams can scale successful strategies and prioritize investments that deliver measurable impact.
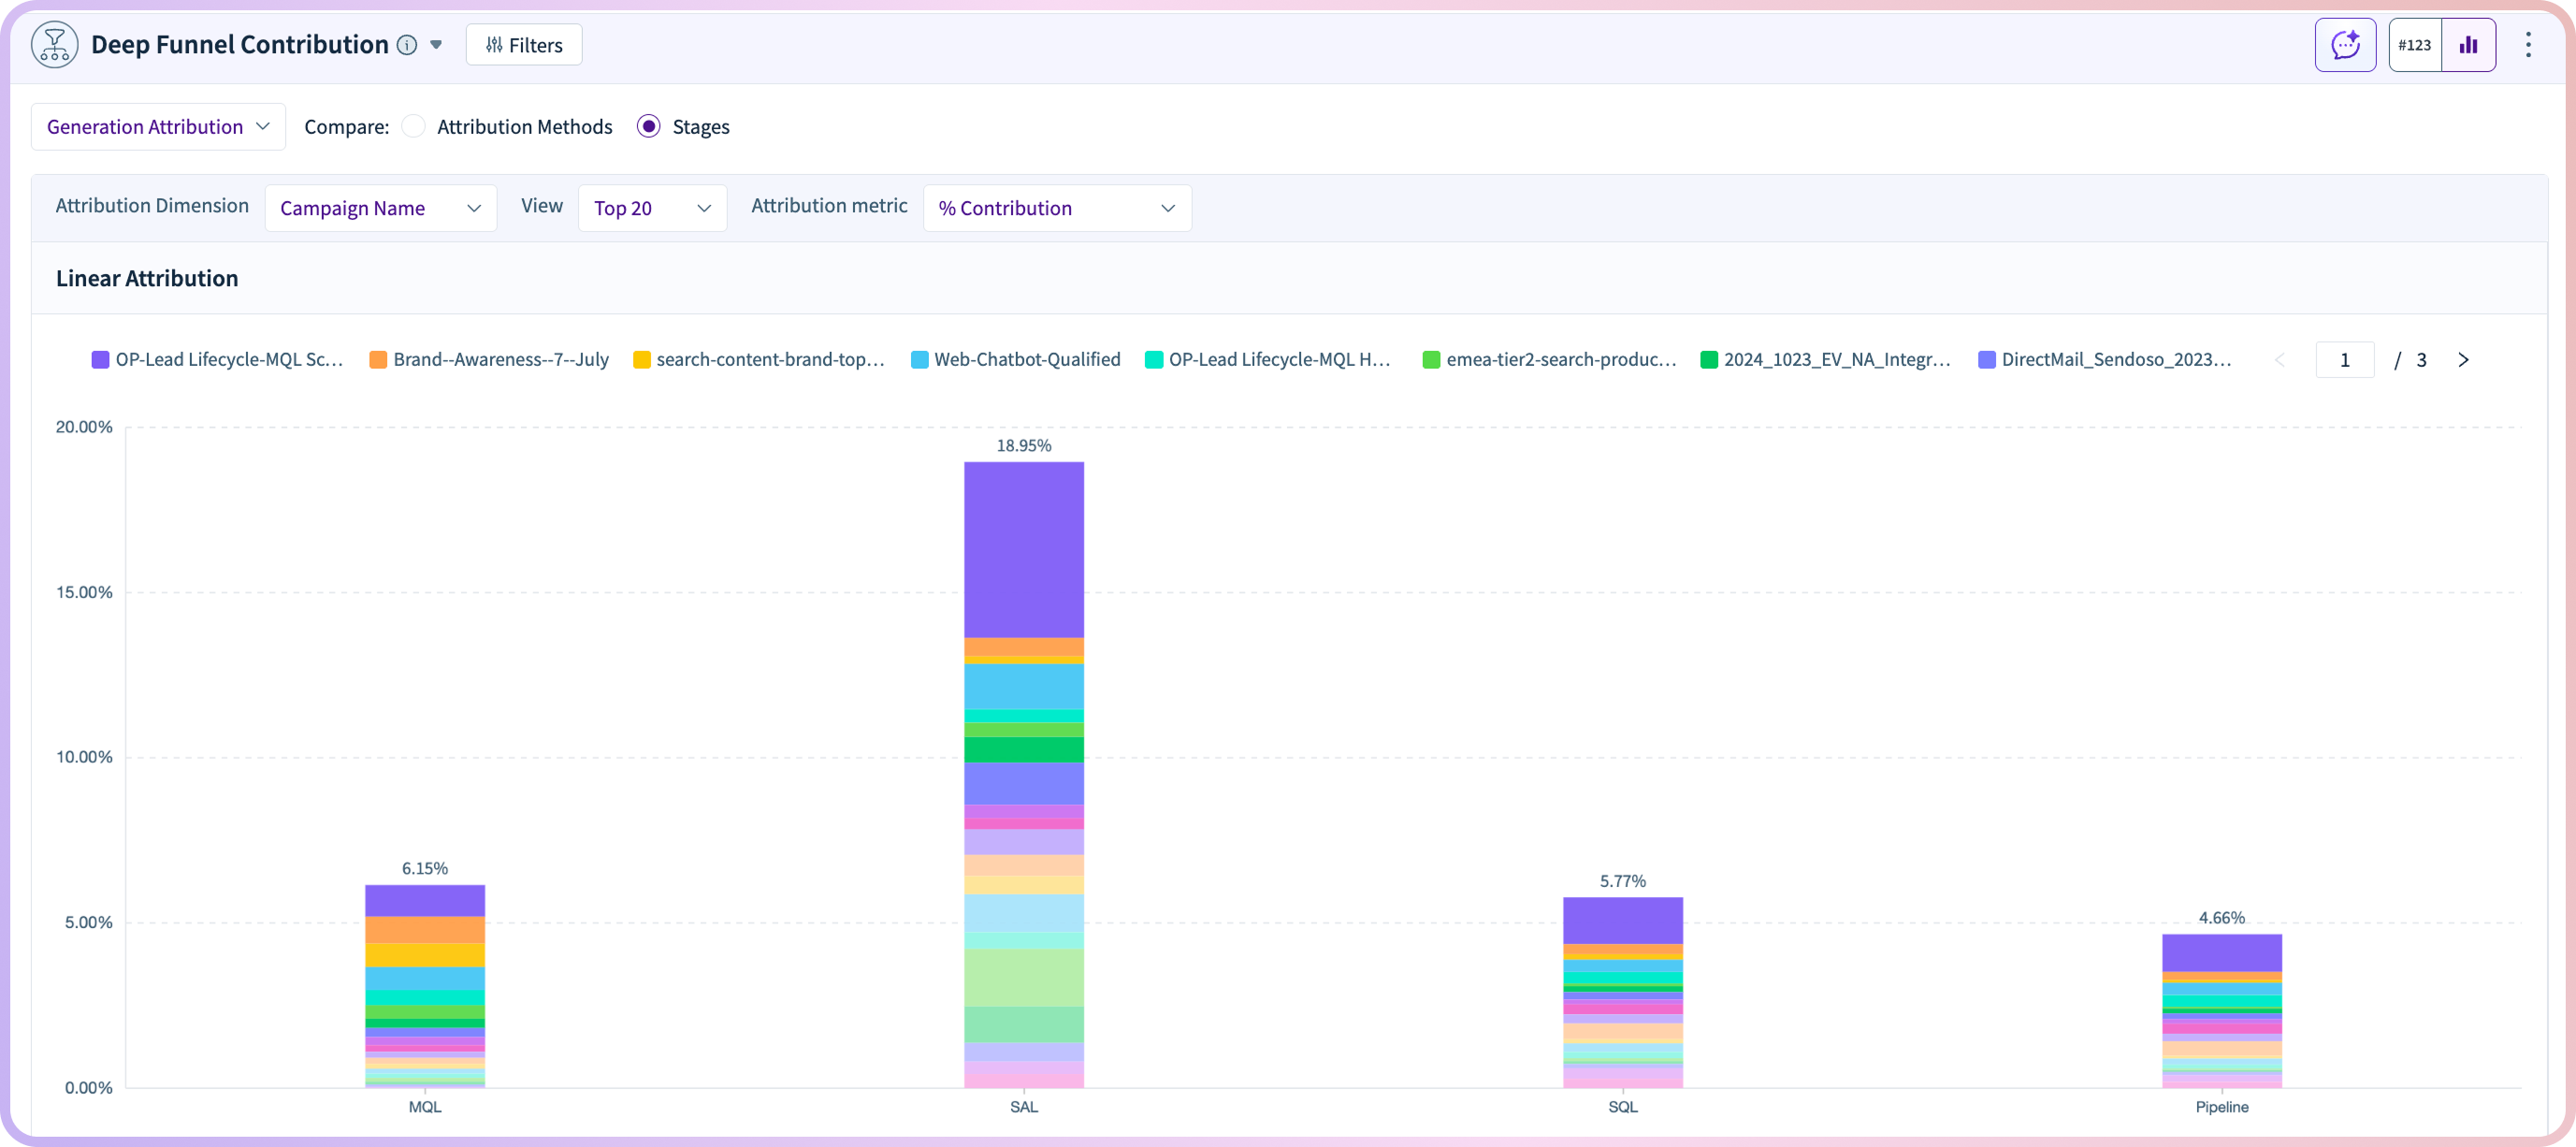
Campaign Contribution Across the Funnel
Beyond overall ROI, the dashboard shows how campaigns contribute at each stage of the funnel. It provides visibility into how paid programs influence early engagement, mid-funnel progression, and final conversion outcomes.
This stage-level insight helps teams understand where campaigns are most effective and where improvements are needed. By optimizing messaging, targeting, and follow-up strategies at each stage, teams can improve overall conversion efficiency.
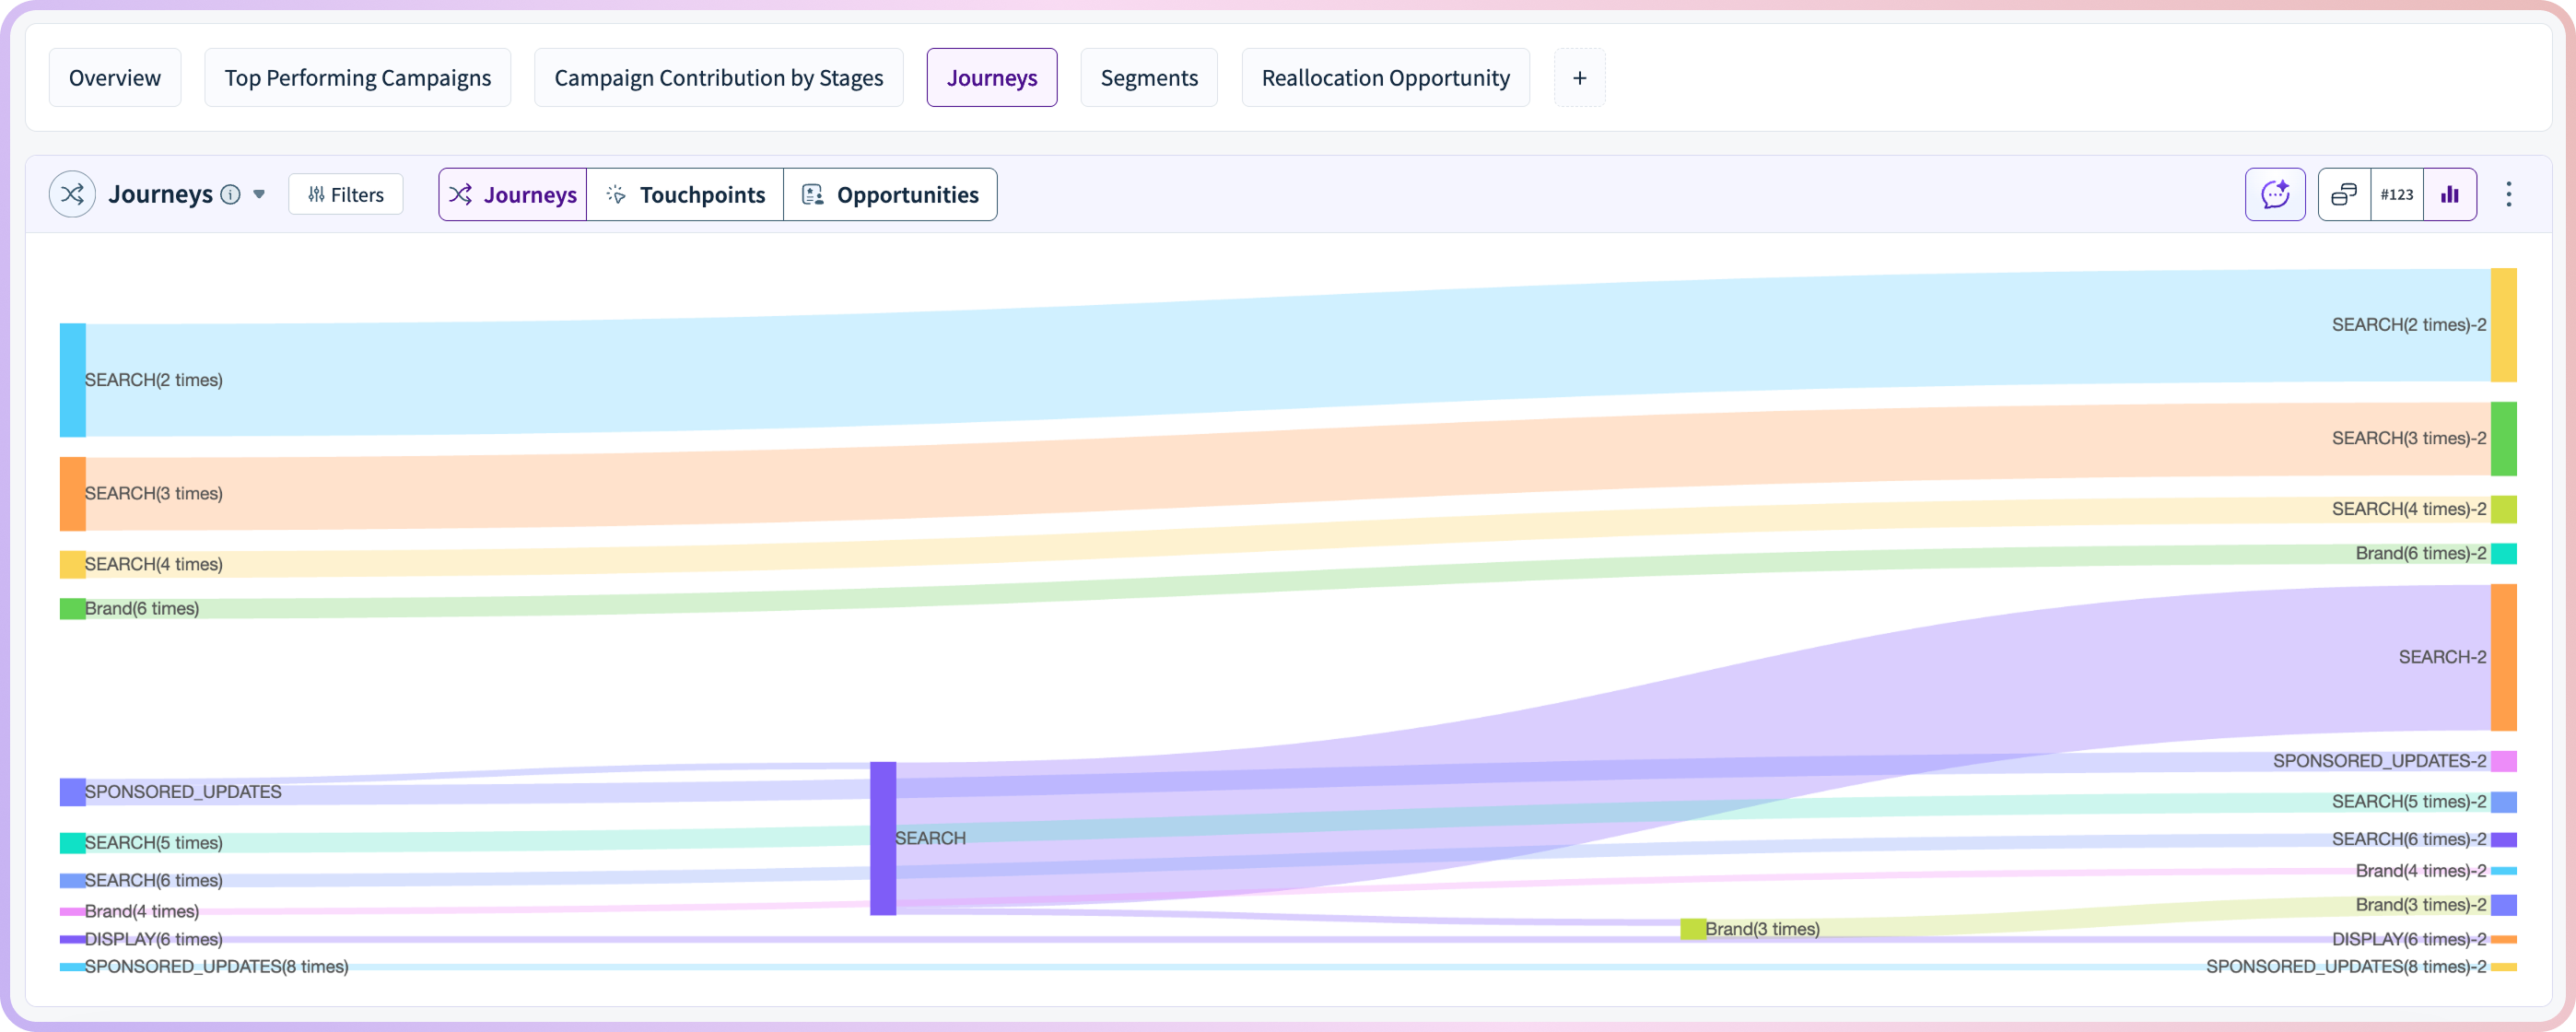
Buyer Journeys and Multi-Touch Impact
Paid campaigns rarely operate in isolation. The template reveals how paid efforts interact with other channels such as events, outbound outreach, and organic engagement within the broader buyer journey.
This view helps teams understand how different touchpoints work together to influence conversion. It also highlights which combinations of channels and campaigns contribute most effectively to opportunity creation, enabling more strategic sequencing and retargeting.
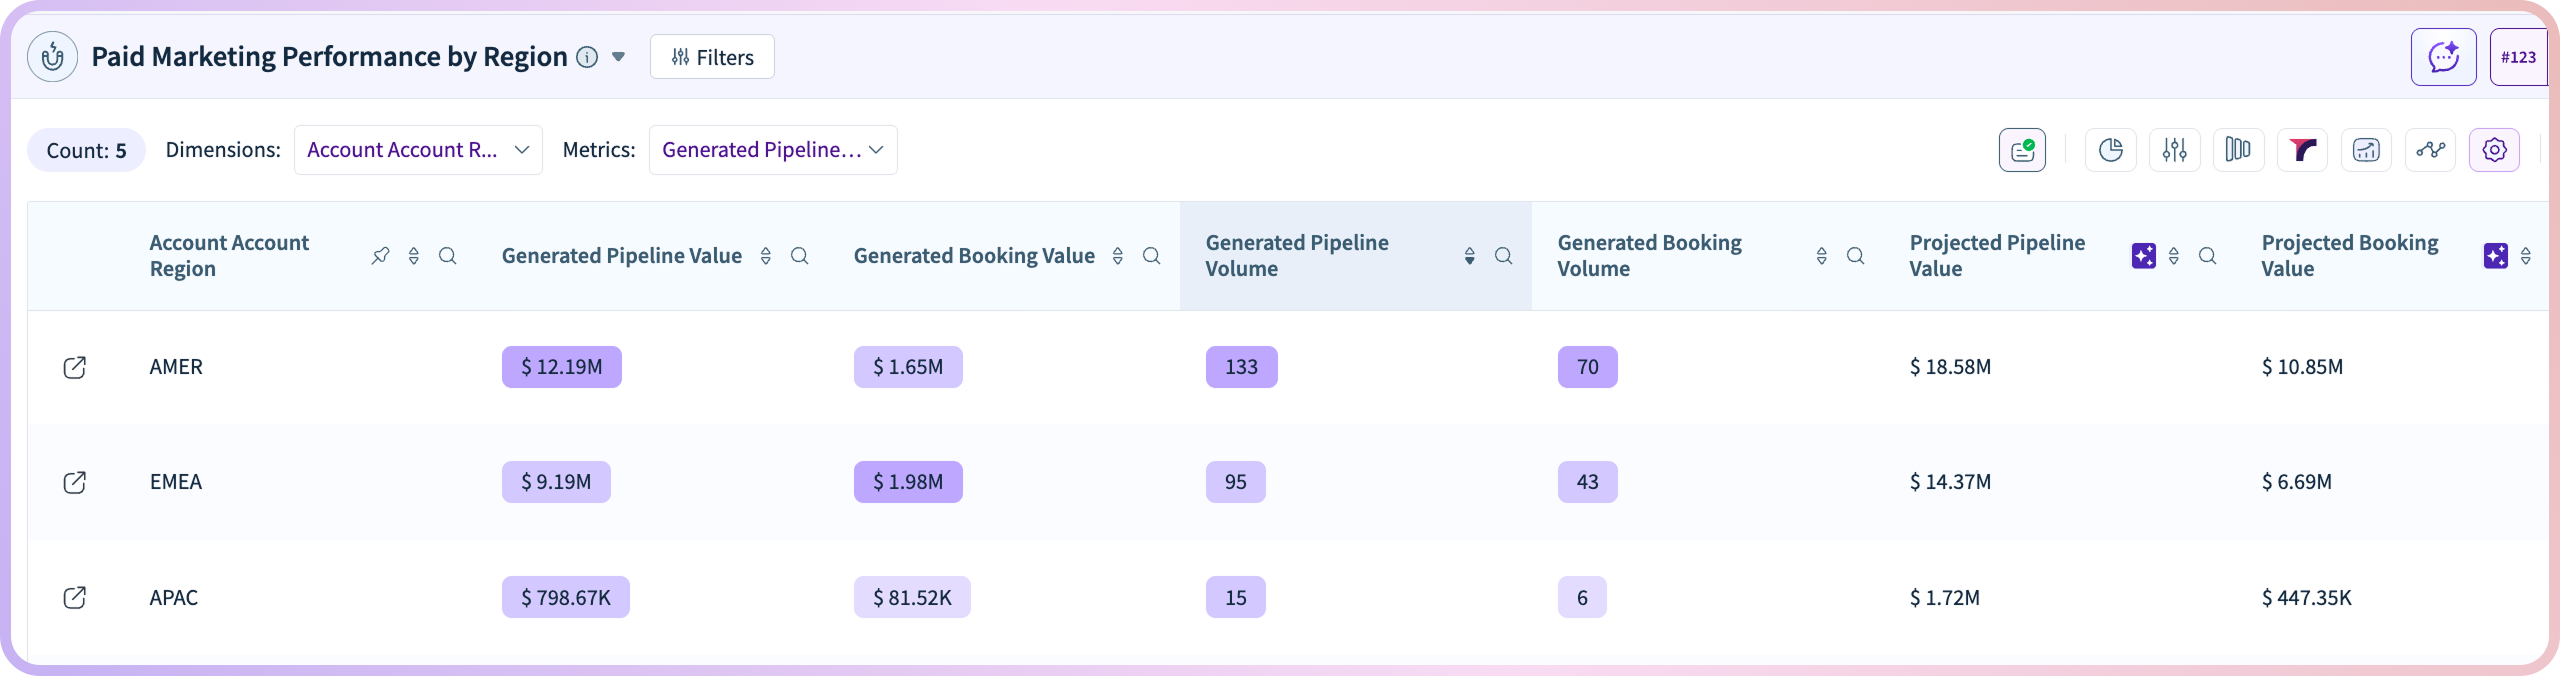
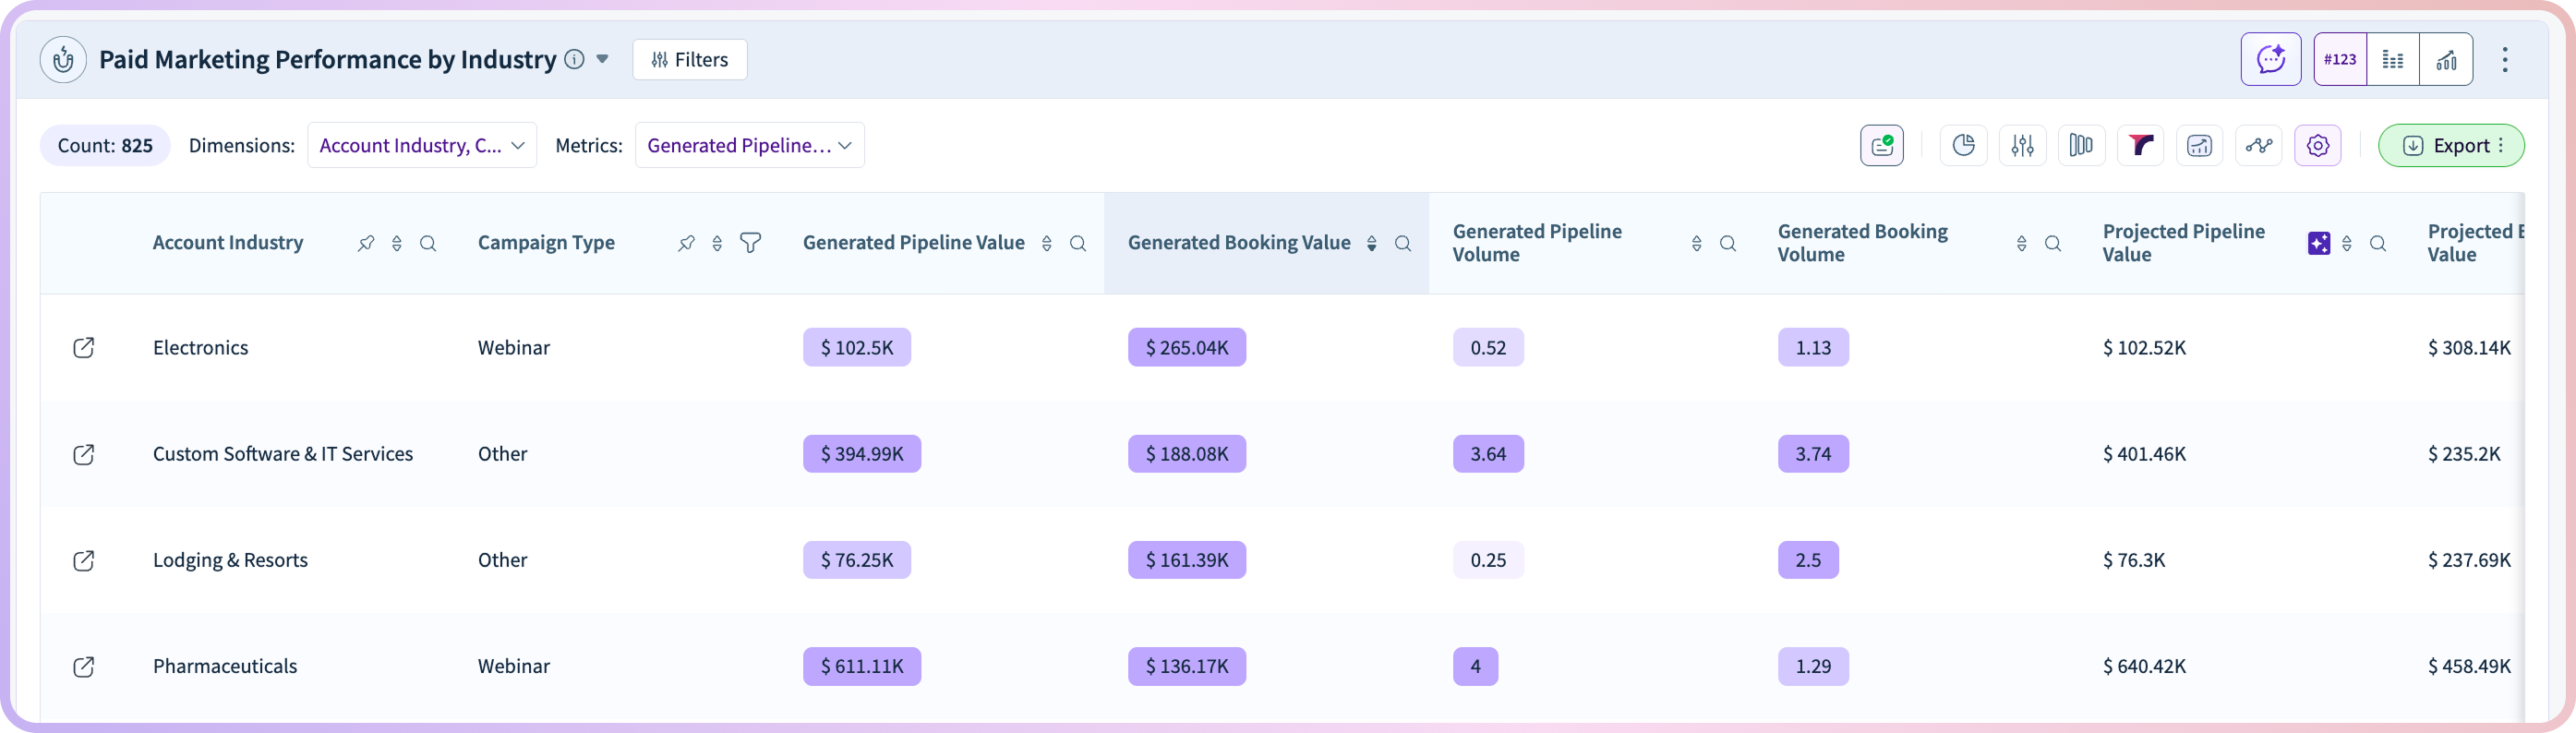
Segment-Level Performance and Optimization
Not all audiences respond equally to paid investment. The dashboard provides visibility into performance across segments such as industry, region, account tier, or ICP fit.
Teams can identify which segments generate the highest ROI, where conversion rates are strongest, and which audiences require refinement. This enables more precise targeting and ensures that paid investment is aligned with the highest-value opportunities.
From Campaign Spend to Revenue Accountability
The Paid Marketing Effectiveness Dashboard Template transforms paid reporting into a revenue-focused decision framework. By connecting spend, pipeline, conversion, and revenue into a single view, it enables teams to optimize performance with confidence.
Marketing teams gain clarity on which campaigns drive results. RevOps can connect spend to funnel progression. Sales benefits from higher-quality opportunities. Leadership gains confidence in ROI and budget allocation decisions.
Next step: If you’re using RevSure, launch the Paid Marketing Effectiveness Dashboard Template to align paid spend with real revenue impact. If not, book a demo to see how RevSure turns paid marketing data into measurable pipeline growth.
Frequently Asked Questions
What is a paid marketing effectiveness dashboard?
A paid marketing effectiveness dashboard shows how campaign spend translates into pipeline, revenue, and ROI across channels, campaigns, and funnel stages.
How do you measure paid marketing effectiveness?
Effectiveness is measured by connecting spend to outcomes like pipeline generated, conversion rates, revenue contribution, and overall return on investment.
Why are traditional paid metrics not enough?
Metrics like clicks and cost per lead don’t reflect business impact. Without linking spend to pipeline and revenue, it’s hard to assess true performance.
What insights does this dashboard provide?
It reveals campaign ROI, pipeline contribution, funnel-stage impact, segment performance, and how paid efforts influence multi-touch buyer journeys.
How does this dashboard track ROI and pipeline contribution?
It connects campaign spend with pipeline creation, opportunity progression, and closed revenue to show how efficiently investment drives outcomes.
Who should use a paid marketing effectiveness dashboard?
Performance marketers, demand generation teams, RevOps, finance teams, and revenue leaders use it to align budget decisions with business impact.
Can this template identify high-performing campaigns?
Yes. It highlights campaigns that generate strong pipeline, high conversion rates, and the best return on investment.
How does it help optimize budget allocation?
By showing which campaigns, channels, and segments deliver the highest ROI, teams can reallocate spend toward top-performing areas.
How is this different from platform-level reporting?
Platform reports focus on campaign activity, while this dashboard connects that activity to pipeline, revenue, and full-funnel performance.
What metrics matter most for paid marketing performance?
Key metrics include ROI, pipeline generated, cost per opportunity, conversion rates across stages, revenue influenced, and segment-level performance.