Revenue Marketing Dashboard | Full-Funnel ROI, Pipeline & Channel Insights
Overview
The Revenue Marketing Dashboard provides a full-funnel, cross-channel view of how marketing drives business outcomes. It enables marketers and revenue teams to optimize spend allocation, strengthen funnel performance, improve campaign ROI, identify content and web pages that influence conversions, and prioritize accounts based on engagement trends.
.png)
Purpose
A comprehensive, multi-layered dashboard designed to assess and optimize revenue-driving marketing efforts. It enables stakeholders to track multichannel performance, lead-to-revenue progression, campaign influence, and content effectiveness—empowering data-backed decisions across marketing, sales, and executive leadership.
Audience

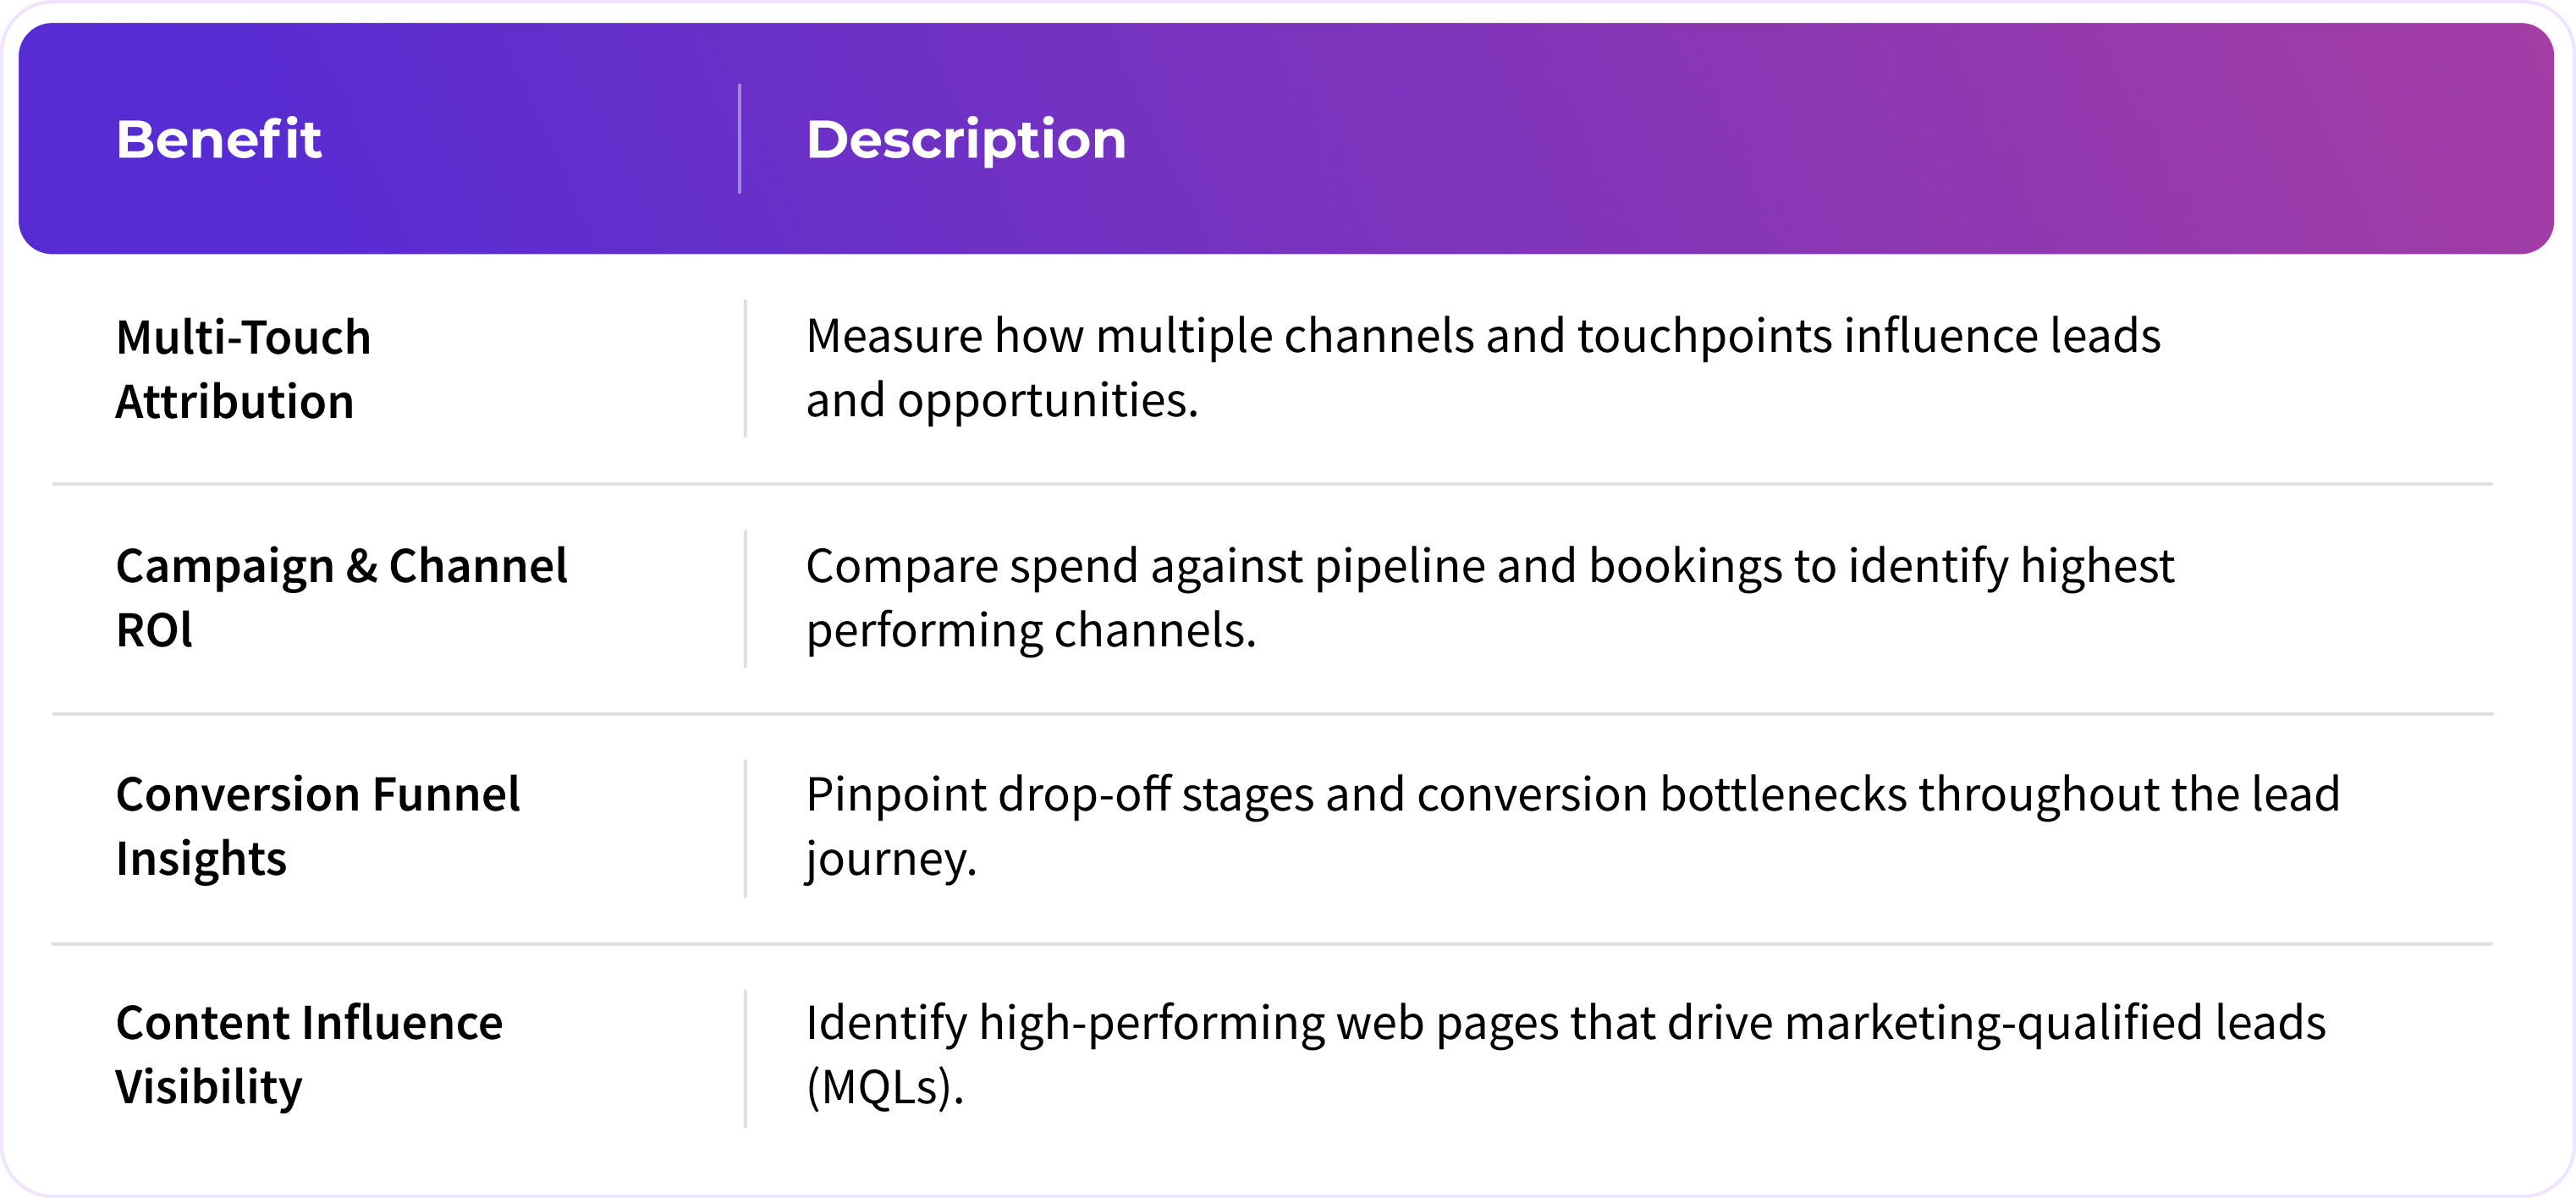
Key Benefits
Global Filters
- Time Period (e.g., Current Fiscal Year, Last 30 Days)
- Funnel Stage (Lead, MQL, SAL, Opportunity, Booking)
- Account Tier (e.g., Strategic, Targeted)
- Attribution Model (First Touch / Last Touch / Multi-Touch)
- Campaign or Channel Type
- Contact Role or Engagement Source
Tabs & Widget Descriptions
Tab: Overview
Goal: Deliver an executive snapshot of marketing health across spend, funnel activity, and campaign ROI.
- Performance Overview (Funnel Health Metrics)
Shows aggregated KPIs—Total Spend, Lead Volume, MQLs, Pipeline Value, Closed Won Bookings and aligns investment to impact and surfaces high-level results instantly. - Current Fiscal Year (Snapshot Funnel KPIs)
Visual display of funnel stages (Lead → MQL → SAL → Opportunity → Booking) with volume per step offering rationale for funnel optimizations. - Current Fiscal Year Snapshot Account View (Snapshot Funnel KPIs)
It delivers a holistic account-level funnel snapshot, showing both volume and conversion progression across key stages. It helps you detect bottlenecks, understand conversion efficiency, benchmark performance, and optimize funnel movement for higher revenue impact - Current fiscal year (Cohort Analysis — Single Start Stage)
It serves as a strategic diagnostic tool that helps you evaluate funnel health, conversion strength, and account-level momentum
Reference:
.png)
.png)
.png)
Tab: Pipeline
Goal: Clarify how marketing efforts translate into pipeline generation and opportunity creation.
- Pipeline Health Overview
Displays current pipeline value, win rate, average age, deal size, and account count for a time period (e.g., quarter), compared to the prior period. It offers a quick health check on pipeline volume, deal velocity, and quality—all in one snapshot. - Pipeline Stage Breakdown
Shows pipeline value, deal count, average age, and duration across every sales stage (e.g. SAL, SQL, Alignment). This layered view exposes where deals are bottlenecked, aging, or concentrated—enabling targeted interventions and improved opportunity flow.
Reference:
.png)
.png)
Tab: Conversion Trends
Goal: Diagnose funnel stage performance and identify where leads most commonly drop off.
- Lead to Contact Progression ( Conversion Trends )
Tracks how many leads were created and the proportion that progressed, remained open, leaked, or regressed during each quarter. It clarifies the funnel’s top-stage volume, drop-off points, and conversion health early in the funnel. - Contact with MQL Progression ( Conversion Trends )
Shows the number of contacts who were created vs those that converted into Marketing Qualified Leads (MQLs), remained open, leaked, or regressed. Helps diagnose MQL quality, lead scoring effectiveness, and symptoms of unproductive lead generation. - MQL to Opportunity Progression ( Conversion Trends )
- Illustrates how many MQLs converted into opportunities, including how many remained open or leaked. Offers visibility into qualification efficiency, funnel bottlenecks between MQL and SQL, and where ideal follow-up is missing.
- Opportunity to Pipeline Progression ( Conversion Trends )
- Displays volume of opportunities created and their progression into pipeline stages, including open, leaked, and regressed counts. Measures pipeline conversion effectiveness, identifies bottlenecks, and supports revenue flow optimization.
Reference:
.png)
Tab: Channel Effectiveness
Goal: Evaluate channel and campaign effectiveness through ROI, lead generation, and influence metrics.
- Channel Effectiveness (Demand Generation Effectiveness)
- Compares spend, booking pipeline, booking volume, and ROI by campaign channel and type (e.g., Email, Paid Social, Events). Helps identify which channels deliver the highest revenue impact per dollar, and which underperform relative to their budget.
- Top Performing Paid Campaigns by Pipeline Generated (Demand Generation Effectiveness)
- Ranks paid campaigns based on spend, pipeline value created, booking ROI, and deal volume. Enables identification of high-value campaigns vs low-return ones—informing reallocation or scaling decisions in campaign budgeting.
- Top Performing Website Campaigns (Demand Generation Effectiveness)
- Highlights web-based campaigns like demos or organic, ranked by pipeline generated, booking volume, and ROI. Supports content optimization by showing which campaigns effectively convert traffic into pipeline and opportunities.
Reference:
.png)
Tab: Website and Content
Goal: Measure the impact of website content paths on lead qualification and MQL generation.
- Website Pages Influencing MQL Creation (Journey View):
Journey view: - Visualizes common page sequences preceding MQL conversion (e.g., homepage → about us → demo), showing step count, average cycle time, and lead volume per path. Helps identify high-conversion user flows and informs optimization of content sequencing and navigation design.
- Touchpoints View:
Displays performance of individual pages—such as homepage or demo page—with metrics like average touches per lead, number of leads engaged, and journey count per page. Highlights which pages consistently engage users across journeys, enabling prioritization of high-impact content for lead conversion strategy. - Advanced Filters:
Filter by journey start, opportunity stage, contact type, and data source (e.g. HubSpot, Salesforce) and facilitates flexible segmentation and deeper analysis.
Reference:
.png)
Tab: Accounts
Goal: Monitor account-level engagement metrics over time to surface growth, intent, and coverage patterns.
- Account Engagement Trends Table:
Monthly view of account-level metrics including campaign touches, activities, LinkedIn impressions & engagement rates, and email sends/opens. It’s a comprehensive engagement dashboard that helps you monitor how marketing interactions evolve, detect trends or declines in coverage, and prioritize high-intent, high-activity accounts for follow-up.
Reference:
.png)