Marketing QBR Dashboard | Full-Funnel Pipeline, ROI & Quarterly Performance
Overview
It delivers a unified full‑funnel view of performance: from TOFU‑MOFU‑BOFU pipeline sourced by marketing, to quarterly pipeline trends, closed‑won attribution, and booking/revenue metrics. It includes dynamic filters and toggles (e.g. volume vs value), and campaign‑level insights like top/bottom performers, opportunity quality, and ROI analysis. The structure supports both executive overview and tactical optimization in a QBR context.
.png)
Purpose
The dashboard serves as a comprehensive quarterly business review tool, offering a unified full-funnel view of marketing performance—from lead generation (TOFU/MOFU/BOFU) through pipeline progression to closed revenue. It enables strategic evaluation of campaign ROI, opportunity quality, and quarterly trends to support business alignment and data-driven planning. Its goal is to help teams make informed decisions and course‑correct proactively.
Audience
- Cross-functional stakeholders (Sales, Customer Success, Finance): to track marketing-sourced pipeline, revenue attribution, and alignment on future goals
- Executive leadership (CMO, VP Marketing, CEO): to review high-level results and strategic alignment.
- Marketing managers and specialists: to analyze campaign performance, funnel efficiency, and ROI.
Key Customer Benefit
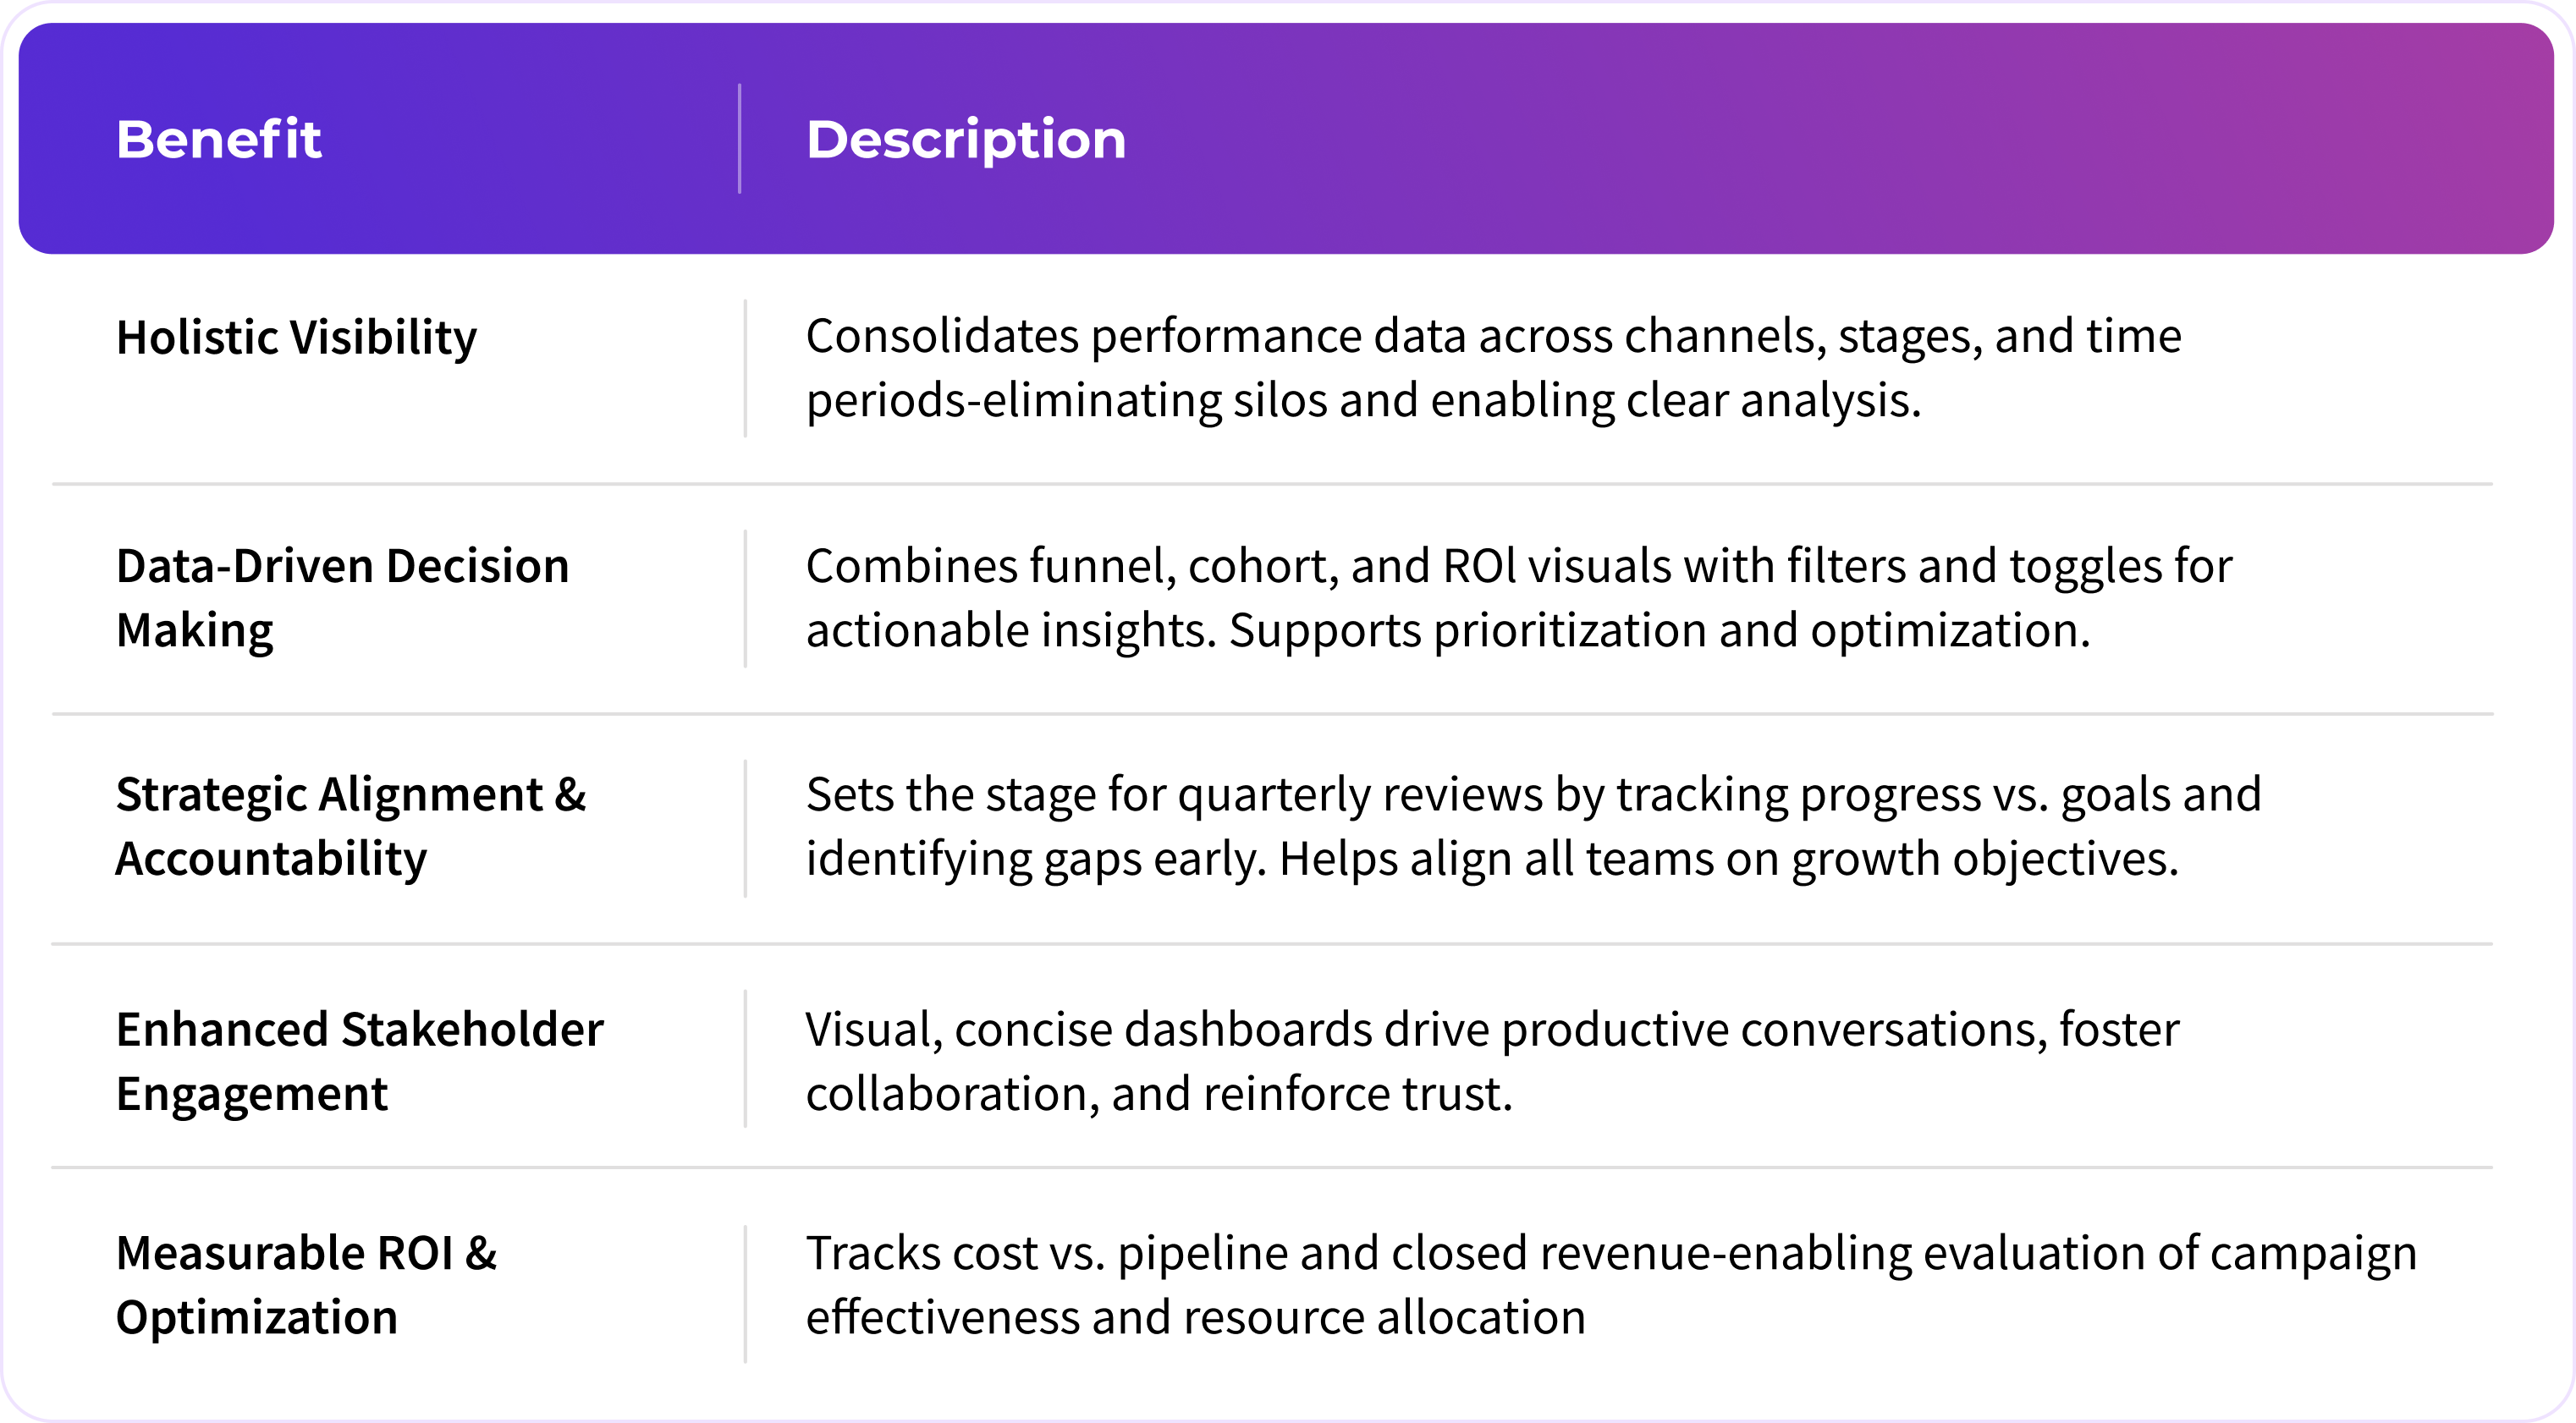
Marketign Source Pipeline breakdown
- Marketing Sourced Pipeline
- Marketing Source Pipeline
- Quarterly Pipeline Performance
- Closed Won Pipeline Sourced by Marketing
- Quarterly Booking Performance
- Opportunity Quality Analysis
- Top 5 Campaigns by Opportunity Creation
- Bottom 5 Campaigns by Opportunity Creation
- Campaign ROI and Optimization
Global Filters
Date period selector, compare-with (prior quarter/month), attribution model (first/multi-touch), opportunity attribution (account/contact), region, campaign source.
Tab & Widget Architecture
Tab: Marketing Sourced Pipeline
Presents the total pipeline opportunities initiated by marketing efforts. Visuals include a full-funnel view (Lead → Closed Won) and cohort breakdowns by source. Helps assess pipeline volume/value and funnel conversion efficiency.
- Widget: Unified Funnel KPIs (Demand Generation Effectiveness)
Shows the funnel progression from Lead through Closed Won, displaying volume or value per stage (e.g. MQL, SQL, Closed Won). This helps identify bottlenecks and prioritize funnel optimization by revealing stage‑drop rates and conversion efficiency. - Widget: Cohort Analysis (Multiple Start Stage)
Breaks down funnel metrics by cohort dimension (like lead source), showing volume/value, conversion %, and velocity at each stage. It helps pinpoint high-performing cohorts for scaling and flag underperforming segments for further investigation.
Reference:
.png)
Tab: Marketing Source Pipeline
Breaks pipeline contributions down by marketing dimensions—campaign type, channel, and source system. Enables analysis of spend efficiency and channel attribution for deeper ROI understanding.
- Widgets by Breakdown:
- Campaign Type (Demand Generation Effectiveness)
- Campaign Channel (Demand Generation Effectiveness)
- Campaign Source System (Demand Generation Effectiveness)
Reference:
.png)
.png)
Tab: Quarterly Pipeline Performance
Shows pipeline generation, progression, and closure trends over quarterly cycles. Includes actual vs projected comparisons and push/pull balances to evaluate pipeline health, velocity, and sustainability.
Widgets by Breakdown:
- Pipeline Snapshot
Captures pipeline value at quarter end versus prior periods, offering historical comparison. This reveals whether pipeline coverage is growing sustainably or requires urgency. - Generation & Progression Trends (Daily Pipeline Generation Trends)
Charts created versus closed pipeline over time (push versus pull), comparing across quarterly cohorts. Insights reveal if pipeline generation is balanced or overloading the funnel.
Tracks stage-to-stage conversion, stage leakage, and cycle times across quarters. This highlights bottlenecks and slow-moving opportunities that need process optimization. - Push vs Pull Trend by Quarter
This widget compares quarterly pipeline generation ("push" – new opportunities created) against pipeline progression or closures ("pull" – advancement through stages or wins), showing both volume and value trends. It helps assess whether pipeline growth is sustainable versus being consumed by conversions, guiding resource allocation to stages where pipeline is either leaking or stable. - Created vs Closed Pipeline
- Compares pipeline creation to closure per quarter side by side, showing net pipeline changes. This enables teams to assess the funnel’s capacity and conversion effectiveness.
Reference:
.png)
.png)
Tab: Closed Won Pipeline Sourced by Marketing
Focuses on closed-won deals attributed to marketing. Breaking out performance by campaign type, channel, and source helps teams quantify revenue delivered via marketing.
Widgets by Breakdown:
- Campaign Type (Demand Generation Effectiveness)
- Campaign Channel (Demand Generation Effectiveness)
- Campaign Source Type (Demand Generation Effectiveness)
- Mirrors campaign type/channel/source system tables, but only includes opportunities that were Closed Won. This helps quantify true revenue impact and identify high‑ROI campaigns for future investment.
Reference:
.png)
.png)
.png)
Tab: Quarterly Booking Performance
Presents booking outcomes like revenue, win rates, and booking velocity—visualized by quarter. Includes actual vs projected booking values and cumulative pacing trends for performance evaluation.
- Booking Trends by Quarter of Close
Plots actual and projected bookings by close quarter, comparing performance to forecast. It clarifies forecasting accuracy and booking execution success. - Win Rate Trends
Displays win percentages by close quarter, revealing quarterly conversion efficiency. It surfaces shifts in deal success rates or pipeline health. - Daily Booking Trends
Shows cumulative bookings by day across quarters for pace analysis. This reveals booking velocity versus prior quarters to guide pipeline management.
Reference:
.png)
.png)
Tab: Opportunity Quality Analysis
A detailed view of high-value, engaged opportunities. With metrics like campaign touchpoints and activity counts, this table helps prioritize sales outreach and understand opportunity health.
- Widget: Opportunity Prioritization
Lists SQL or pipeline-stage opportunities with metrics like campaign touch count and activity volume. It helps prioritize high-engagement deals for sales follow‑up and pipeline acceleration.
Reference:
.png)
Tab: Top/Bottom Campaigns by Opportunity Creation
Highlights the most efficient campaigns based on opportunity generation. Compares spend, pipeline volume/value, and booking outcomes, offering a clear view of winners.
A parallel view showing underperforming campaigns. Useful for optimization, campaign pruning, or reallocation decisions.
- Widget: Demand Generation Effectiveness
Side-by-side views of the top 5 and bottom 5 campaigns by oppty creation volume. Metrics include spend, pipeline volume/value, and booking metrics.
Reference:
.png)
Tab: Campaign ROI and Optimization
Shows campaign ROI and offers "what-if" reallocation analysis. Projects uplift in pipeline and bookings when spend is shifted from low-return to high-return campaigns—empowering smarter budget decisions.
- Demand Generation Effectiveness
Shows performance for all campaigns in one table, enabling comparative analysis across portfolio. It supports broader ROI benchmarking and campaign prioritization. - Campaign Reallocation (Booking Generated)
Simulates the impact of reallocating spend from low-ROI to high-ROI campaigns on bookings. Shows projected uplift in pipeline/bookings and ROI, guiding investment shifts. - Campaign Reallocation (Pipeline Generated)
- A similar simulation focused on pipeline dollars rather than bookings. Helps quantify long-term funnel benefits and customizes reallocation strategy accordingly.
Reference:
.png)