Marketing Performance Dashboard | Full-Funnel ROI, Pipeline & Campaign Insights
Overview
A centralized full-funnel dashboard tracking TOFU through closed revenue—visualizing pipeline, bookings, ROI, and campaign effectiveness across channels. It supports cohort segmentation, dynamic toggles, and campaign-level insights, enabling both executive oversight and tactical optimization.
.png)
Purpose
This dashboard delivers a cross-channel view of marketing performance—from TOFU → BOFU, through pipeline and bookings, to revenue attribution and ROI analysis. It combines full-funnel visualization, cohort segmentation, and campaign-level ROI modelling, and supports both executive performance review and tactical campaign optimization.
Audience
- Marketing managers & specialists: track funnel efficiency and ROI metrics.
- Cross‑functional teams (Sales, Finance, CS): align on pipeline contributions and forecasting.
- Executives (CMO, VP Marketing, CEO): monitor revenue impact and strategic execution.
Key Customer Benefits
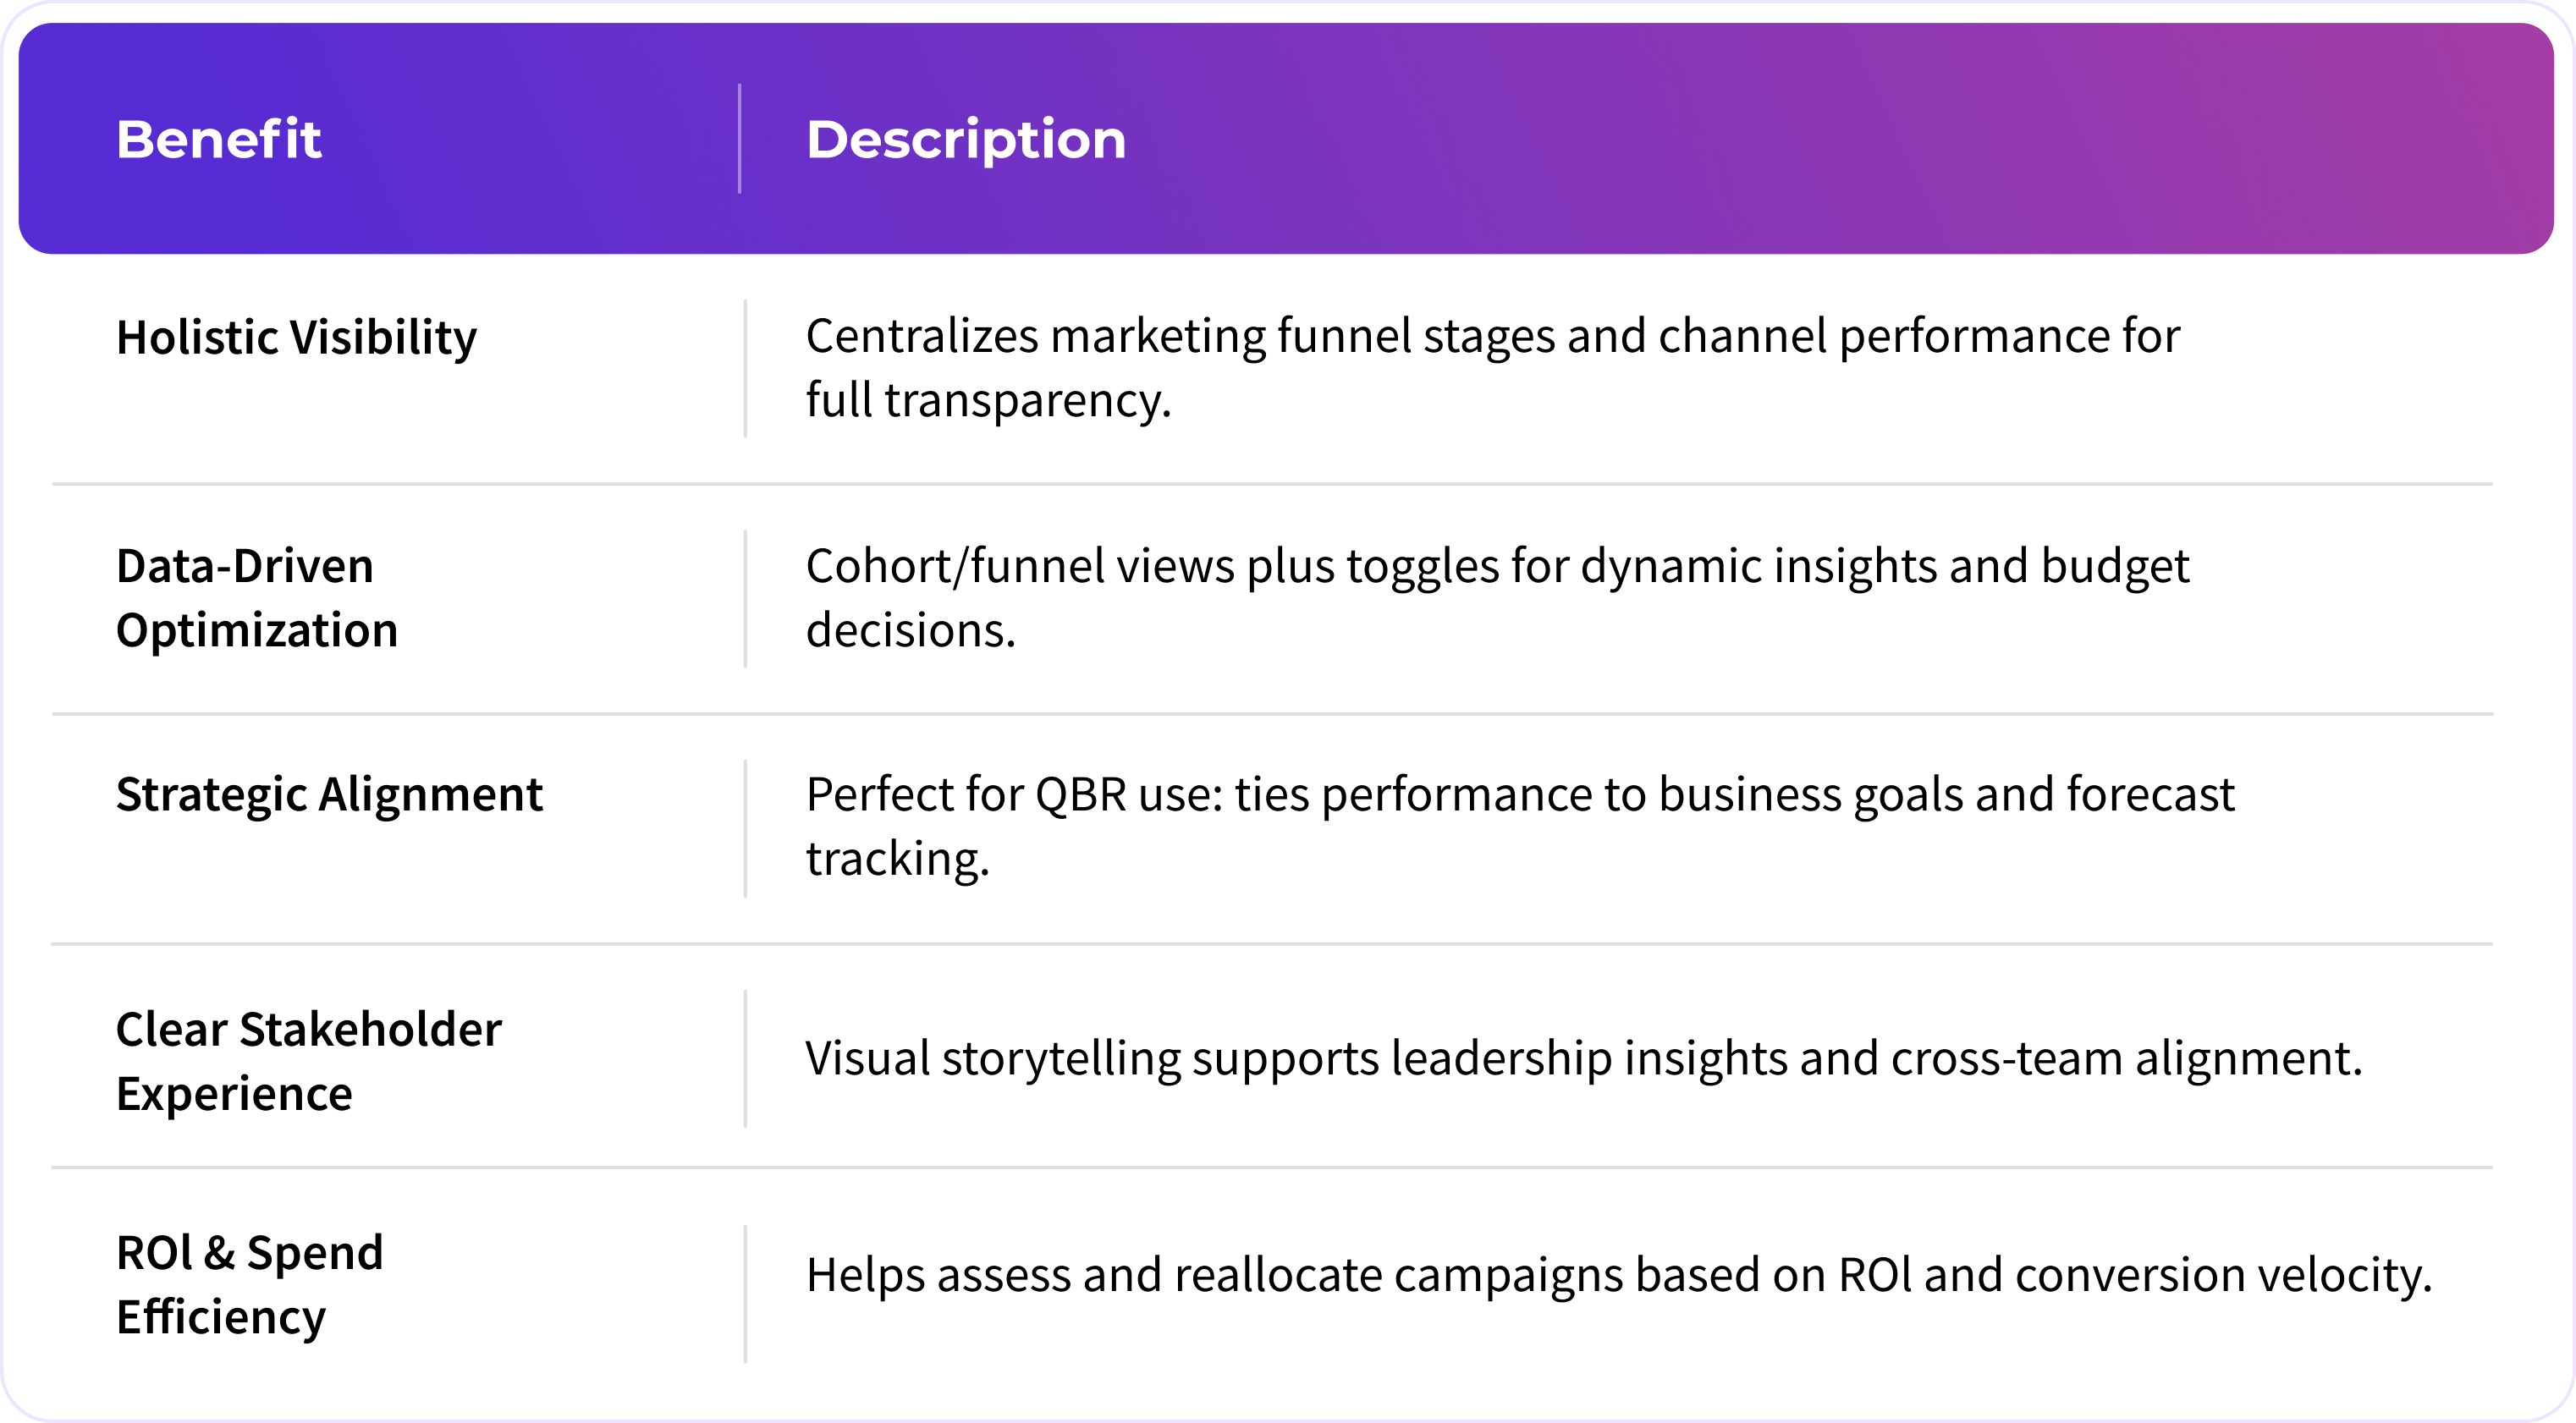
Global Filters
Date selector, comparison mode (prior period), attribution model, opportunity attribution (account/contact), campaign source, region.
Tab & Widget Architecture
Tab: Overall
Purpose: Executive-level snapshot of cross-channel performance and spend efficiency.
- KPI Scorecards (Marketing Attribution Performance Overview)
Displays Spend, Cost‑per‑Lead, Pipeline Value, Booking Revenue, and ROI. Fast insight into overall marketing health and efficiency. - Demand Generation Effectiveness Table
Breaks down spend vs outcomes (pipeline/bookings) by campaign channel and type to support budget decisions.
.png)
Tab: Paid Spend Performance Tab
Purpose: Shows spend trends across fiscal periods.
- Spend Trend Chart ( Demand Generation Effectiveness )
Highlights spending patterns in the last 365 days, the previous fiscal year, and current fiscal year.
Reference:
.png)
Tab: Channel Effectiveness
Purpose: Compares efficiency and ROI across marketing channels.
- Channel Effectiveness ( Demand Generation Effectiveness Table )
Summarizes spend against pipeline and booking metrics per channel and campaign type. Identifies high-performing channels vs underperformers.
Reference:
.png)
Tab: LinkedIn / Sendoso / Google Ads Campaigns
Purpose: Platform‑specific campaign performance at high granularity.
- Campaign-Level Tables ( Demand Generation Effectiveness Table )
For each platform, it shows spend, lead volume, pipeline/bookings, ROI, and engagement metrics per campaign. Enables tactical optimization at the campaign level.
Reference:
.png)
.png)
Tab: Impact of Increasing LinkedIn Spend
Purpose: Evaluates the causal impact of LinkedIn spend on funnel outcomes.
- Funnel Health Metrics Widget
Visualizes LinkedIn spend vs SAL (Sales Accepted Leads) volume trends month-over-month. - Conversion Trends Widget
Tracks how changes in spend align with meeting bookings over time. - Pre- & Post-Analysis Widget
Quantifies pipeline/pipeline value uplift before vs after spend shifts, including statistical significance.
Reference:
.png)
.png)
.png)
Tab: Journeys
Purpose: Illuminates top multitouch sequences and touchpoint influence on conversions.
- Journeys Visualization
Shows common engagement pathways (e.g., Paid Social → Content → Paid Social) with associated opportunity counts. - Touchpoint Insights Table
Aggregate performance metrics by touch type, such as average touches per opportunity and coverage of unique sequences. Helps inform attribution modelling.
Reference:
.png)
Tab: Conversion Deep Dive
Purpose: Deep insight into funnel conversion performance by segment.
- Conversion by Industry
Shows conversion percentages between selected funnel stages across industries, current vs prior fiscal year. - Conversion by Company Size
Same conversion metrics segmented by company headcount buckets. Highlights which verticals and firm sizes move fastest through the stages.
Reference:
.png)