ABM View Dashboard | Track Target Account Engagement & Pipeline ROI
Overview
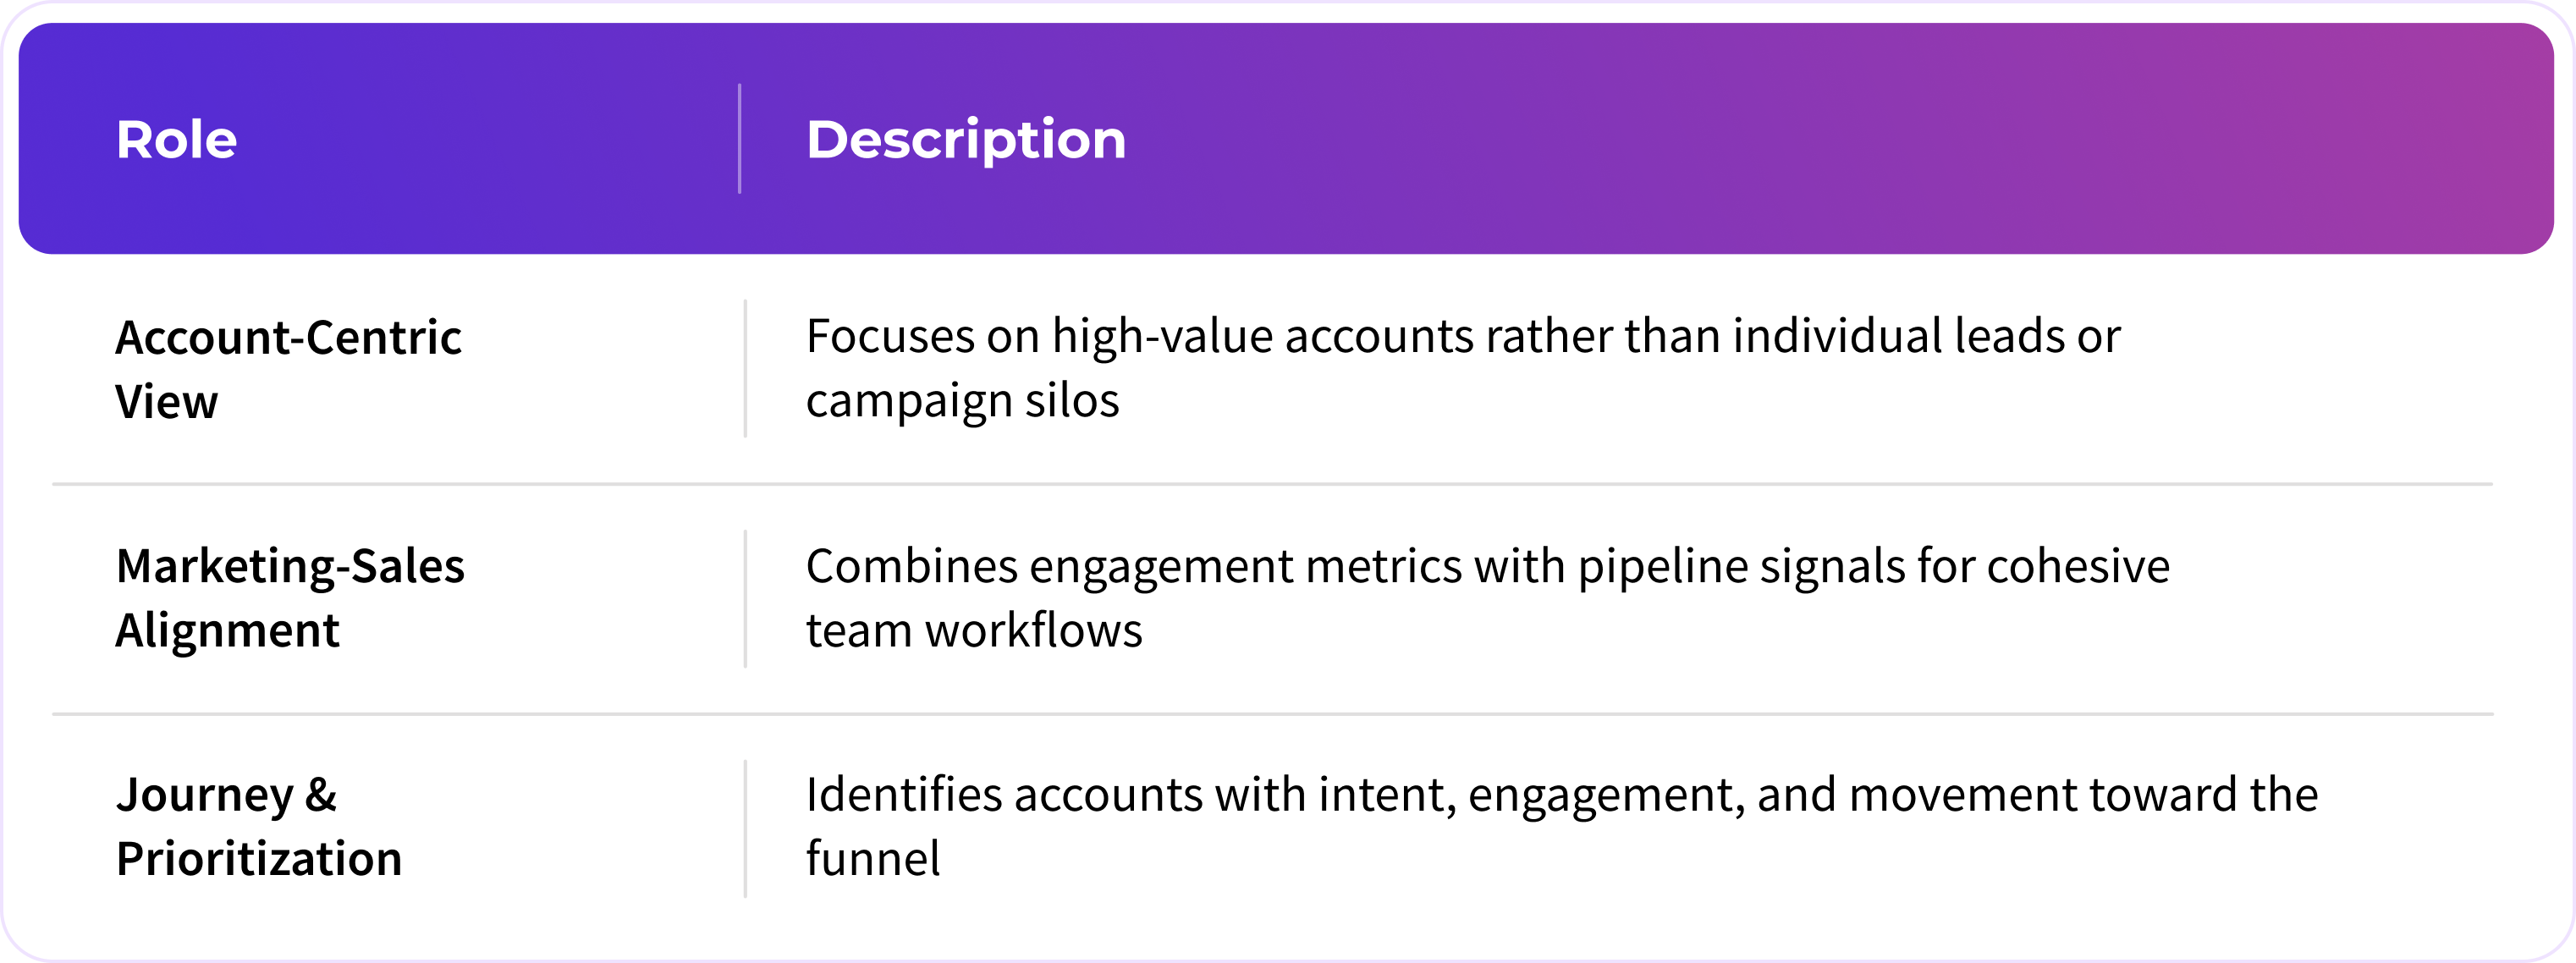
The ABM View Dashboard serves as a centralized account-based marketing tool that tracks target account engagement, pipeline progression, and marketing attribution. It aligns sales and marketing by visualizing intent signals, journey paths, and campaign impact—all to prioritize outreach and optimize ROI at the account level.
.png)
Purpose
A strategic, account-centric dashboard that tracks engagement, pipelines, and account-level attribution to prioritize high-value accounts and align marketing with sales. Designed for precision targeting and performance visibility.
Audience
- Demand Gen & Marketing teams (monitor account engagement & campaign impact)
- Sales & RevOps (track coverage and activity within target accounts)
- Executives (CMO / CRO) focused on strategic account growth and ROI impact
Key Benefits
Global Filters
Account tier, timeframe (e.g., current fiscal year), attribution model, engagement type, journey criteria
Tab & Widget Breakdown
Tab: Overview
Purpose: Offers a high-level ABM performance summary across all target accounts. It contextualizes how marketing efforts are impacting engagement, pipeline, and revenue at account level.
Widgets by Breakdown:
- Marketing Attribution Performance Overview
Summarizes Budget, Spend, Generated Leads, Pipeline & Booking Value, and ROI across target accounts. A concise executive view of account-level marketing impact. - Account Metrics Table (Funnel Health Metrics)
Displays number of open accounts: those with and without activity, lead touches (LinkedIn, email), and inactive accounts. Ideal for spotting engagement gaps within key targets. - Account Trends Table (Funnel Health Metrics)
A month-over-month breakdown showing trends in account engagement and pipeline behavior. Essential for monitoring ABM enrollment progress and pipeline momentum. - Account Engagement Trends Summary
Summarizes account-level engagement metrics—impressions, page visits, campaign touches—over time to determine which channels drive the most interaction.
Reference:
.png)
.png)
Tab: Account Journeys
Purpose: Reveals how target accounts evolve through touchpoint sequences and engagement paths over time.
Widgets by Breakdown:
- Journey Path Visualization
Maps the most common engagement sequences (e.g. Sponsored Update → Form Submission), with metrics such as average days to conversion and account counts for each path. - Touchpoint Insights Table
Analyses performance by touch type—including average touches per account, unique journey counts, total touch volumes, and coverage. Helps identify the most effective engagement channels.
Reference:
.png)
.png)
Tab: Top Accounts to Prioritize
Purpose: Helps sales and marketing teams zero in on accounts with high intent and readiness for follow-up.
Widgets by Breakdown:
- Accounts with High Intent Page Visits (Account Prioritisation)
Lists individual accounts with high-intent signals: page visits, contacts, campaign touches, activities, leads, opportunity and booking status. Perfect for targeted follow-ups.
Reference:
.png)