On this page
Revenue teams are under more pressure than ever to prove impact, forecast accurately, and make faster decisions. But when funnel visibility is limited to high-level conversion charts or static reports, it becomes difficult to answer the questions that actually matter: Where are we losing momentum? Which segments are stalling? Are we improving efficiency, or just increasing volume?
That’s exactly why RevSure is introducingFunnel Conversion Breakdown, a new widget within our Advanced Analytics & Forecasting capabilities. This enhancement is built for analysts, marketing leaders, and revenue operators who need to explore performance across funnel stages with more clarity, more flexibility, and far less manual effort.
Instead of exporting to spreadsheets, stitching together reports, or waiting on custom analysis, teams can now perform detailed funnel investigation directly inside RevSure, where performance data already lives, updates automatically, and aligns with GTM execution.
What is Funnel Conversion Breakdown?
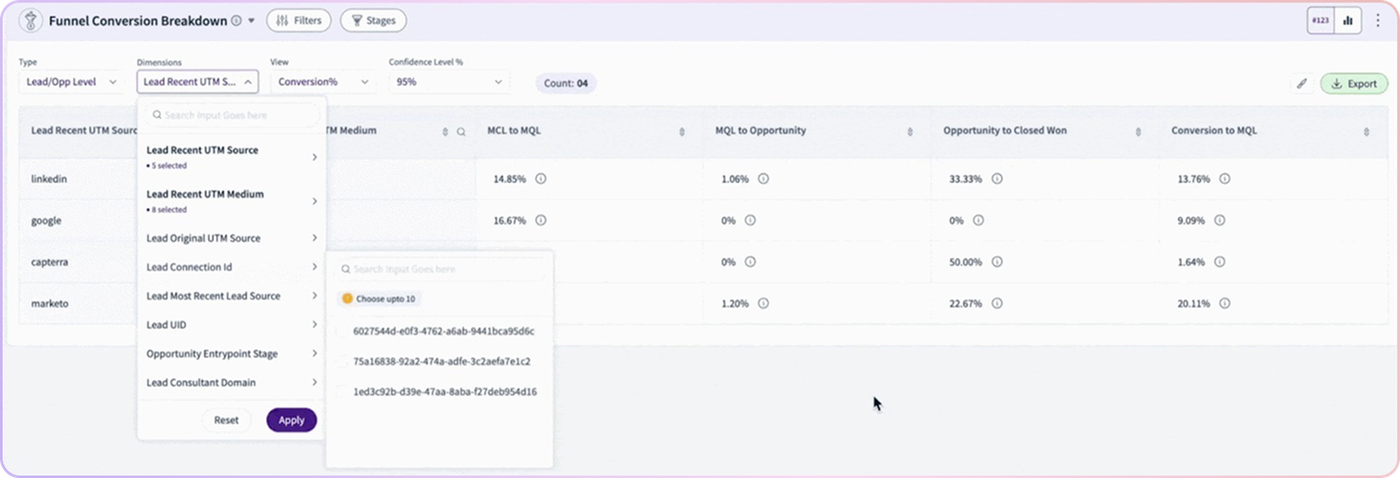
Funnel Conversion Breakdown helps you analyze how leads, opportunities, or accounts move through the funnel across different segments. It enables configurable comparisons of funnel stages, multi-dimensional breakdowns, and key metrics such as Conversion % and Velocity, making funnel insights more measurable, explainable, and actionable.
Most funnel reports show the “what” at a broad level- conversion rates at each stage, or total volume passing through. Funnel Conversion Breakdown is designed to show the “why” behind those movements by letting you slice funnel progress across segments and pinpoint exactly where conversion strength or weakness is coming from.
This widget is available within two key areas of the RevSure experience: theMarketing Performance Dashboard and the Funnel Health module. Together, these views help teams go beyond surface-level dashboards and dig into funnel behavior with the level of detail needed to optimize outcomes.
Why funnel analysis needs more than just a conversion rate
Conversion rates are helpful, but they rarely tell the full story. A funnel may look stable overall while specific segments quietly deteriorate. Or conversion might improve at one stage while velocity slows down dramatically, creating hidden pipeline drag that surfaces weeks later as missed targets.
Funnel Conversion Breakdown brings a more complete approach by allowing you to see how progression changes across different groups, how stage comparisons perform over time, and how efficiently prospects or deals are moving forward.
This matters because funnel performance isn’t just about “how many converted.” It’s also about:
- Whether the best-fit segments are converting at a healthy rate
- Whether your funnel is accelerating or slowing down
- Whether growth is driven by better efficiency or just more top-of-funnel volume
- Whether specific stage transitions are becoming bottlenecks
When teams can answer these questions quickly, they can act earlier, course-correct faster, and build more predictable revenue impact.
What you can do with Funnel Conversion Breakdown
Funnel Conversion Breakdown gives teams the power to explore funnel health without being limited to pre-defined views. You can compare the funnel stages that matter to your business and analyze performance through multiple lenses, enabling more informed decisions across campaigns, channels, segments, and GTM motions.
Here are a few of the key outcomes teams unlock with this widget:
1) Configurable funnel stage comparisons
Different teams define funnel success differently. Some care about conversion from Lead to MQL, others focus on MQL to SQL, and revenue teams might look at opportunity stages or account progression. Funnel Conversion Breakdown enables stage comparison flexibility so you can align analysis with what your business considers meaningful.
Instead of relying on one rigid funnel definition, analysts can explore stage movement based on the exact transitions they need to optimize. This is especially valuable when GTM teams are evolving definitions, testing qualification criteria, or changing funnel structure.
2) Multi-dimensional breakdowns for deeper insight
High-level averages hide segment-specific truths. A funnel might look fine overall, but performance can vary dramatically by segment. Funnel Conversion Breakdown introduces multi-dimensional slicing so you can investigate conversion behavior across the segments that matter most.
This means you can explore whether funnel issues are widespread or isolated, and whether improvements are coming from broad efficiency gains or just one strong cohort carrying the results.
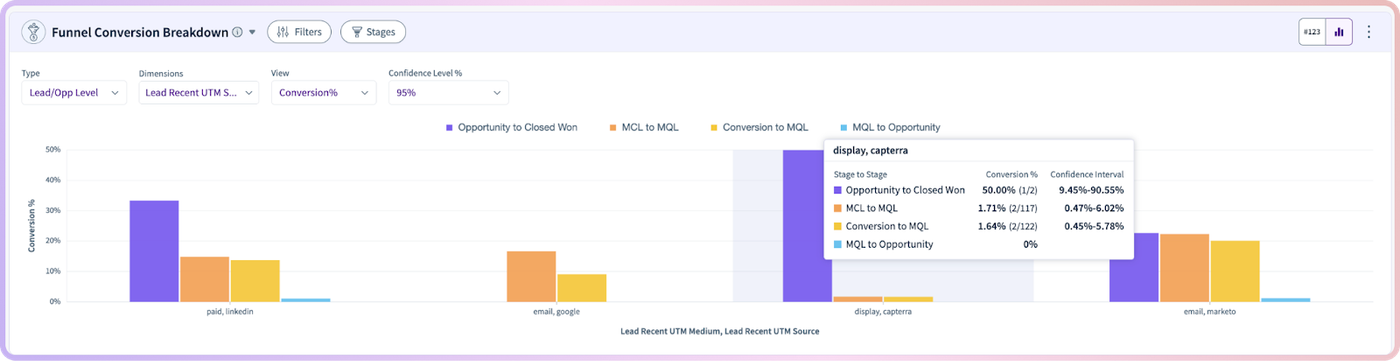
3) Conversion % plus Velocity for full-funnel clarity
A healthy funnel must convert and move forward efficiently. Conversion rate alone doesn’t reveal whether the pipeline is stagnating, slowing down, or becoming harder to progress.
Funnel Conversion Breakdown includes key metrics like Conversion % and Velocity, allowing teams to measure not only how much moves forward, but also how fast. That combination is critical for forecasting accuracy, pipeline quality, and campaign planning.
The business value: faster answers, better decisions, stronger outcomes
Funnel Conversion Breakdown is designed to reduce time-to-insight and increase confidence in decision-making. When funnel analysis requires manual work, it’s often delayed—and delayed insight becomes a missed opportunity.
With this widget, teams can identify trends early and take action sooner. For example, a drop in conversion at a key stage could indicate a targeting mismatch, a messaging issue, or a channel quality decline. A slowdown in velocity might point to friction in qualification, handoffs, or follow-up cadences.
When these issues are detected quickly, teams can iterate while impact is still recoverable, not weeks later when results have already cascaded into missed pipeline goals.
Here are some of the ways RevSure customers can use Funnel Conversion Breakdown to drive real improvements:
- Pinpoint stage-level drop-offs and isolate where prospects disengage
- Identify segments with stronger conversion efficiency for scaling
- Detect velocity slowdowns before they become pipeline risk
- Compare funnel performance across cohorts to validate optimization efforts
- Align marketing and revenue teams with a shared view of funnel health
This transforms funnel tracking from reactive reporting into proactive performance management.
Built for analysts, accessible for marketing leaders
Not every stakeholder has time to run complex analyses or wait for someone else to do it. Funnel Conversion Breakdown is built to support both technical and business users by making funnel exploration self-service, repeatable, and accessible within the workflows teams already use.
For analysts and RevOps users, the multi-dimensional breakdowns and configurable stage comparisons allow quick investigation and validation of hypotheses. For marketing leaders, the widget provides clarity around funnel performance without needing external tools or manual report building.
Most importantly, it enables shared visibility across teams. When marketing and revenue stakeholders are viewing the same funnel truths, measured the same way, in the same system, alignment becomes much easier, and decisions become more productive.
Key metrics you can trust in one unified view
Funnel Conversion Breakdown focuses on metrics that matter for funnel optimization and forecasting readiness. By bringing Conversion % and Velocity into the same analysis experience, teams can assess both effectiveness and efficiency simultaneously.
This is crucial when determining whether to:
- Invest more in specific segments
- Reallocate spend from low-performing cohorts
- Update lead qualification criteria
- Improve stage-to-stage handoff processes
- Shift campaign strategy to maximize downstream performance
When funnel performance becomes measurable at this level, improving it becomes far more actionable.
Turn funnel data into funnel strategy
Funnel performance is one of the most powerful leading indicators for revenue impact. But only when it’s measurable, explorable, and understood across teams.
With Funnel Conversion Breakdown, RevSure customers gain a clearer view into how the funnel behaves across segments, where performance shifts are happening, and what actions will drive stronger conversion and faster velocity. It’s a major step forward in enabling teams to move from surface-level reporting to deep funnel intelligence, directly inside RevSure.
If your team is ready to go beyond “how much pipeline did we create?” and start answering “what’s actually driving funnel outcomes?”,this widget was built for you.