On this page
Dashboards have become the operating system of B2B go-to-market teams. Open any browser tab across Marketing, Sales, or RevOps, and you’ll likely find dashboards tracking campaign spend, pipeline velocity, lead conversions, and more. At face value, it looks like progress: visibility, data, and transparency everywhere.
But here's the uncomfortable reality: most dashboards aren't designed for decision-making. They are built to monitor, not move. They surface data, but rarely deliver clarity. They show what happened, but not what changed, and almost never explain why it changed.
Most B2B marketing decision-makers lack confidence in their ability to connect campaign efforts to revenue impact. Meanwhile, a majority of GTM leaders cite misalignment across marketing, sales, and operations as a key source of inefficiencies in pipeline generation and forecasting. The result? Billions in potential revenue lost—not due to a lack of effort, but a lack of unified insight.
And it’s not just a data integration problem. It’s a context problem.
The average GTM team uses over 20 tools across their stack, from CRMs and MAPs to ABM platforms and intent data providers. Each delivers a slice of the story—campaign engagement here, sales stages there, account signals somewhere else. Stitching it all together? That falls on humans in Ops. And even then, the result is often a static, backward-looking report that doesn’t inspire meaningful action.
Here's the bigger issue: Vanity metrics have overstayed their welcome.
- A 5% click-through rate doesn’t tell you if the account moved past the demo stage.
- A spike in impressions doesn’t tell you which industry or region is warming up.
- An MQL count tells you nothing about conversion velocity or deal size.
At a time when marketing budgets are under pressure, SDRs are spread thin, and buyers are more self-directed than ever, we can’t afford to celebrate clicks. We need to celebrate movement—from interest to intent, from awareness to opportunity, from campaign to pipeline. And that requires a shift: from dashboards that track activity to systems that show account progression.
The Problem: GTM Visibility ≠ GTM Clarity
The explosion of tools, data, and metrics was supposed to make our jobs easier. In theory, we have more insight than ever. In practice, we have more noise. Why? Because the data we look at often reflects operational outputs, not business outcomes.
Here’s what that looks like in reality:
- A digital campaign dashboard tells you how many leads you generated, but not whether any of those accounts progressed in the funnel.
- Your ABM tool shows account engagement, but not whether Sales followed up or if the deal ever moved.
- Your revenue report shows pipeline growth, but not which GTM activities influenced it.
Each piece exists, but they don’t talk to each other. That disconnect is where misalignment creeps in. Marketing celebrates engagement, Sales complains about quality, and RevOps plays referee.
The New Standard: From Dashboards to Decision Systems
If your GTM dashboard can’t answer these three questions, it’s time to rethink it:
- What changed in the pipeline because of this campaign or initiative (Not just how many MQLs we created)
- Which accounts moved, by how much, and why? (Not just who clicked or downloaded.)
- Where are we building compounding momentum, and where are we stalling? (Not just “channel performance.”)
This is what separates traditional dashboards from what modern GTM teams actually need: connected, context-rich campaign intelligence.
We don’t need to see more data—we need to see the right relationships between data points:
- Engagement → Account movement
- Account movement → Funnel progression
- Funnel progression → Revenue impact
When you can trace that full arc, you stop optimizing for clicks and start optimizing for conversion, velocity, and deal quality.
The Turning Point: Seeing Campaigns Through a Pipeline Lens
This shift isn’t just theoretical—it’s happening right now. Take the example of Abdallah Al-Hakim, Sr. Director of Digital Marketing at Abnormal Security. Like many digital leaders, he’s spent years navigating a maze of dashboards, trying to extract actionable insights. But something clicked recently when he explored campaign performance through a different lens—inside RevSure AI.
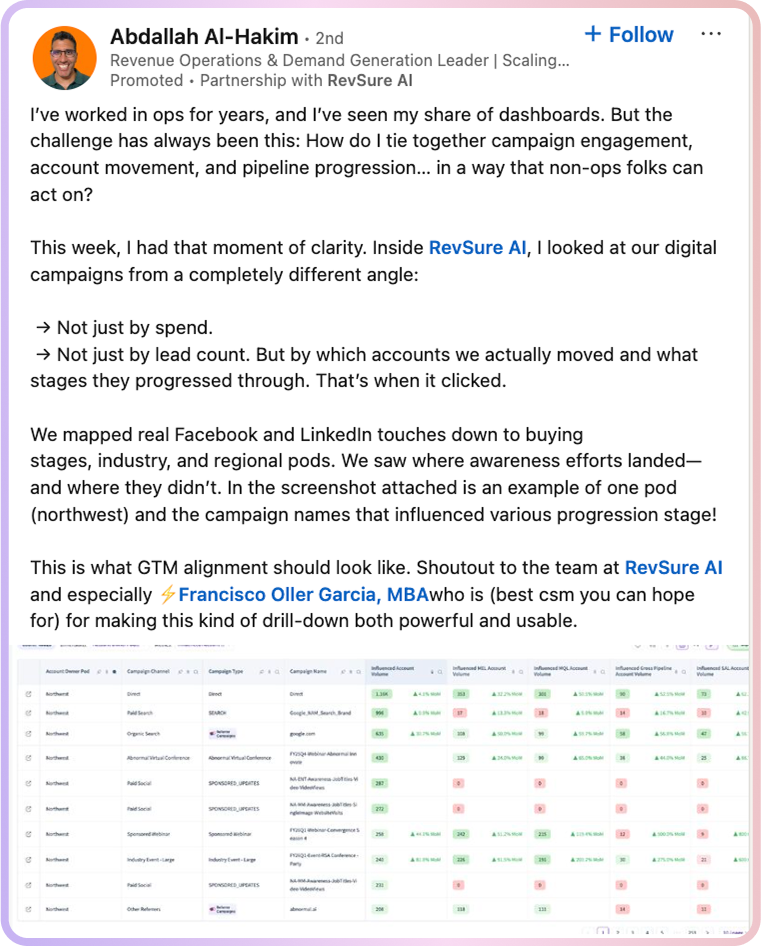
Instead of just measuring how much was spent or how many leads were captured, he focused on the actual pipeline movement triggered by specific campaigns. Using RevSure, he was able to:
- Map real LinkedIn and Facebook touches down to buying stages, industry verticals, and regional pods.
- Analyze which campaigns actually influenced progression, not just engagement.
- Visualize where awareness efforts were landing, and where they weren’t.
The result? A clear view of what was working, what wasn’t, and where GTM efforts were gaining real traction.
“This is what GTM alignment should look like,” Abdallah noted in his LinkedIn post (link), praising both the depth of insight and the usability of the platform. It wasn’t about finding more data; it was about making the right data useful across the entire GTM team.
Why This Matters More Than Ever
In today’s B2B landscape:
- Buyers engage anonymously across dozens of touchpoints.
- Sales cycles are longer and more nonlinear.
- Marketing budgets are under scrutiny.
- Every team is being asked: What’s moving the needle?
That question can’t be answered with lead counts or spend summaries. It requires connected insights that align campaign execution with buyer behavior and revenue impact. This is exactly where platforms like RevSure shine.
They don’t just track. They tie. They connect marketing, sales, and RevOps around a single source of truth that speaks in the language of pipeline movement and revenue acceleration.
So the next time you look at a dashboard, ask yourself: Is it showing you what happened? Or is it showing you what to do next? Because the future of GTM isn’t about looking back. It’s about moving forward together, with clarity.