On this page
Modern-Day Decision-Making Fatigue
Did you know the average adult makes about 35,000 decisions per day? It sounds excessive, but these include micro-decisions like "Should I snooze my alarm again?" to high-stakes ones like "Why is our Enterprise pipe coverage so low this quarter?"
Decision fatigue is real. That’s partly why organizations created "middle management" , to delegate decisions. But even with the best structures in place, poor decisions still happen. And often, it’s because they're based on incomplete or misleading information.
Consider the infamous Red Lobster promotion in 2003. The company offered an all-you-can-eat snow crab deal for $20, vastly underestimating how much customers could eat. The result? Soaring costs, no profit, and a near-bankruptcy experience.
This isn't just a quirky marketing fail; it mirrors how B2B SaaS companies misread pipeline health. The consequences? Lost budgets, missed targets, and months of revenue recovery.
What Pipeline Health Really Means
Pipeline health is the connective tissue between top-of-funnel demand and bottom-of-funnel revenue. It's more than just how many deals are in the system; it's about the quality, velocity, conversion, and predictability of those deals.
Here are the metrics you should be tracking:
Lead to Opportunity
- MQL to SQL %
- Lead to Opp velocity
- Lead mix (source, industry, persona)
- Lead leakage rate (by stage, industry, persona)
Opportunity to Closed-Won
- SQL to Pipe %
- Pipe to Win % (Win Rate)
- Loss Rate (segmented by reasons)
- Sales Velocity
- Pipe Coverage
- Average Sales Price (ASP) by region
- Sales Forecast
- Average Sales Cycle
- CAC
- Total Pipeline Value by Stage
- LTV
- LTV:CAC Ratio
- Opportunity to Closed Velocity
- Pipeline mix (new vs existing business, target segment)
But metrics alone won’t drive action. You need visibility into why these metrics are what they are.
Role Play: What Smart Funnel Analysis Looks Like
Imagine a typical sales-marketing sync:
Danny (Marketing): "Our LinkedIn campaign brought in 509 MQLs. Facebook brought in 121."
Sophia (DemandGen): "Great. What are the downstream conversions?"
Mike (CMO): "And which personas dropped off? How long did they take to convert?"
Danny: "LinkedIn MQLs converted at 42% to SQL; Facebook at 37%. Not sure about velocity or drop-off personas. I’ll get back to you."
Sid (SVP Sales): "What’s their contribution to pipeline?"
Danny: "Facebook's data is in a GSheet. LinkedIn is coming tomorrow."
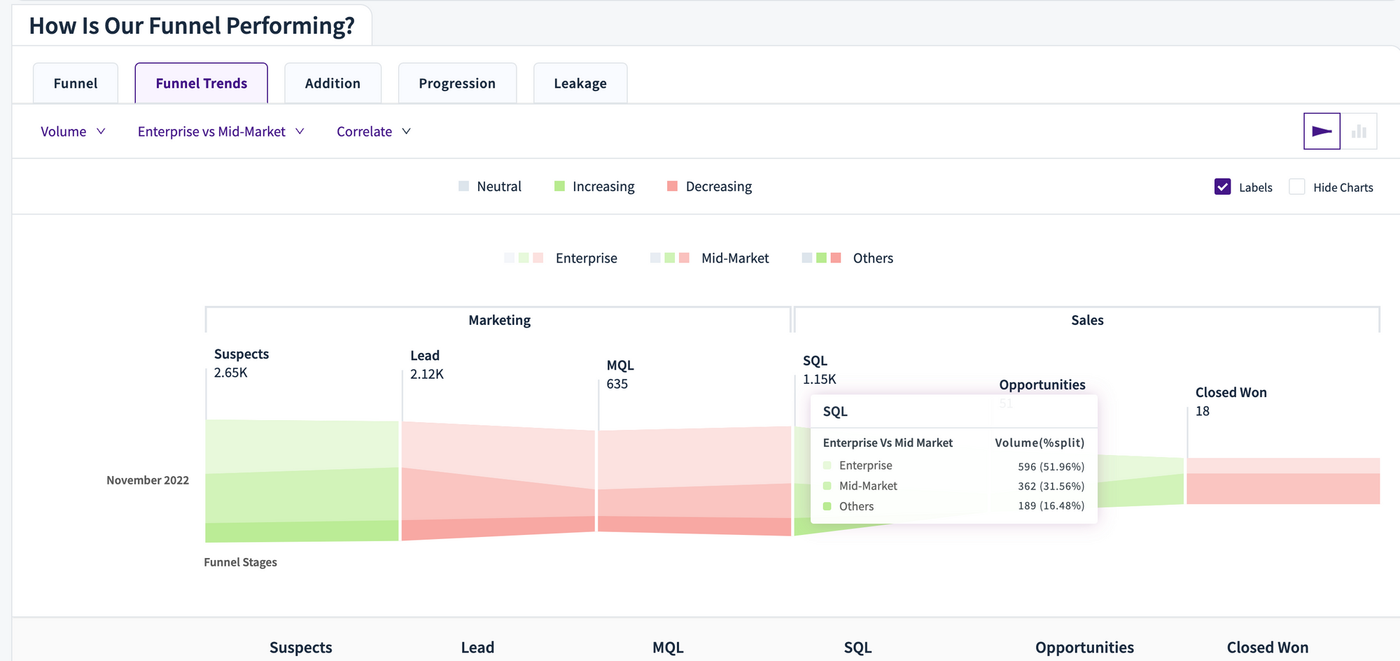
If Danny had RevSure, the conversation would sound very different:
"Our LinkedIn campaign generated 509 MQLs and $1.1M in pipeline, but with a high drop rate at POC. Facebook's 121 MQLs led to $950K pipeline and a better ASP. Let’s reallocate the budget accordingly."
Outcomes:
- Marketing reallocates budget with confidence.
- Sales knows which campaigns generate high-quality pipeline.
- The CRO can report strategic insights to the board.
RevSure’s Funnel Analytics makes this possible.
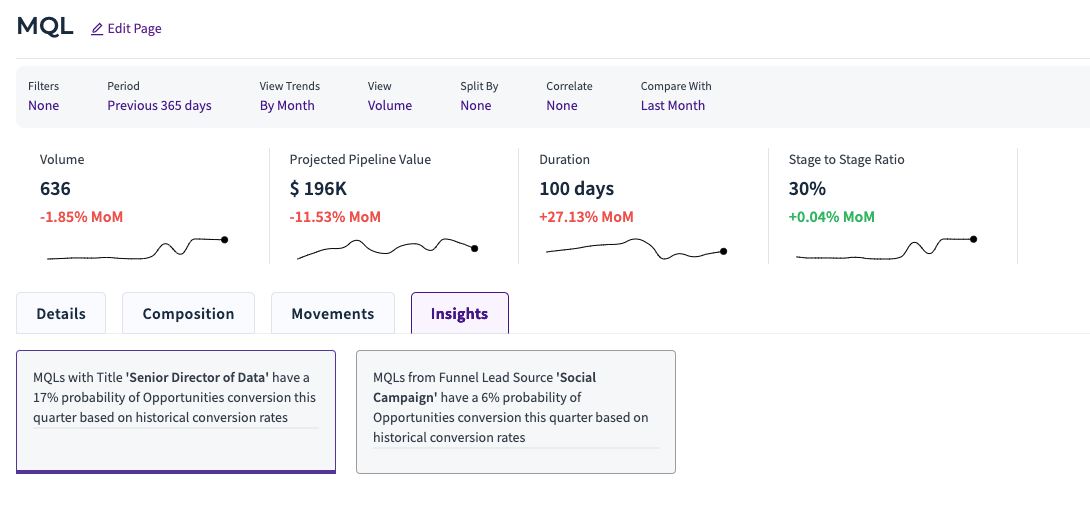
Metric Deep Dive: SQL to Pipeline %
If your SQLs aren’t converting to pipeline, you have a misalignment in ICP scoring. Your marketing team thinks one thing; sales experiences another. Want to understand pipeline mix by Enterprise vs SMB, region, or campaign? This is what SalesOps and GTM leaders crave for effective strategy.
Use RevSure’s Pipeline Analytics to see:
- Which deals are progressing
- Which were carried over
- Which are net-new
- Which are leaking
No more Google Sheets. Just live pipeline movement insights.
Win Rate: The Devil’s in the Details
Your win rate may look good on the surface. But unless you're breaking it down by segment, you're missing the story.
Say you're investing in LATAM but seeing no uptick in win rate. Meanwhile, EMEA and SEA deals from organic channels are performing well. That’s budget wasted on campaigns that don’t convert.
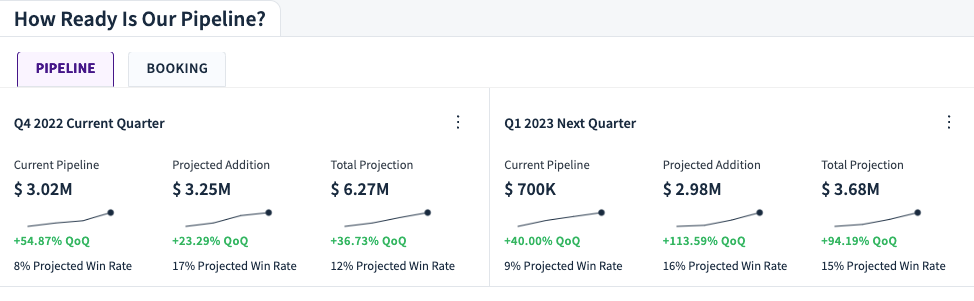
With RevSure’s Pipeline Projection, you can:
- Compare win rates across markets
- Tie pipeline generation to specific campaigns
- Predict next quarter’s revenue by region or segment
When Budgets Are Cut, Insights Win
Imagine your CMO needs to cut $500K in marketing spend. Instead of guessing, they say: "We'll reduce $350K in EMEA ad spend, which has underperformed historically during Christmas campaigns." Now that’s strategic. Use RevSure’s Revenue Cockpit to:
- Track cohort movement across funnel stages
- Break pipeline down by region, channel, and persona
- Justify budget with confidence
Final Word: Operational Advantage = Competitive Advantage
In a world where an F1 car can change all four tires in under 2 seconds and generate a terabyte of data per race, your GTM team needs the same telemetry.
RevSure is your cockpit for pipeline health. It tracks, analyzes, predicts, and guides your funnel strategy so you can move from reactive to proactive. Because in today’s GTM world, predictability isn't a luxury, it's the baseline. Book a demo today!