Know where the quarter lands. Before it lands
RevSure tracks pipeline performance, booking and win-rate trends, stage progression, and AI-projected push and pull rates in one customizable workspace.
Pipeline movement · QTD
- Started quarter
- 412
- Added
- +138
- Pulled in
- +21
- Pushed out
- −46
- Closed lost
- −39
- Closed won
- −58
- Active today
- 428
Opportunities · all segments
Pipeline analytics shows how pipeline is created, moves, converts, and changes over time. RevSure connects every opportunity to an identity-resolved context layer, so sales, marketing, finance, and RevOps work from the same view of pipeline health and forecast risk.
From pipeline snapshots to a forward-looking forecast
A complete view makes the quarter's movement visible while there is still time to act.
- 01
Unify pipeline data
Bring CRM, marketing, sales, and activity data into one governed view.
- 02
Track movement
See what was added, advanced, pushed, pulled, won, and lost.
- 03
Measure conversion
Compare win rate, velocity, and stage progression across every segment.
- 04
Project risk
Model expected push and pull rates before close-date changes impact the plan.
The forecast call opens with a debate
When every team rebuilds a pipeline view in a different spreadsheet, the conversation starts with numbers that do not match.
You see where it landed
Quarter-end reports explain the miss after it happened, not the movement that caused it.
Close dates quietly move
Pushed and pulled deals reshape the quarter week to week before the forecast catches up.
Bottlenecks found too late
A stage that slows by two weeks surfaces only when win rates drop a quarter later.
Every team, its own report
Sales, marketing, and finance rebuild the same pipeline view and the numbers never match.
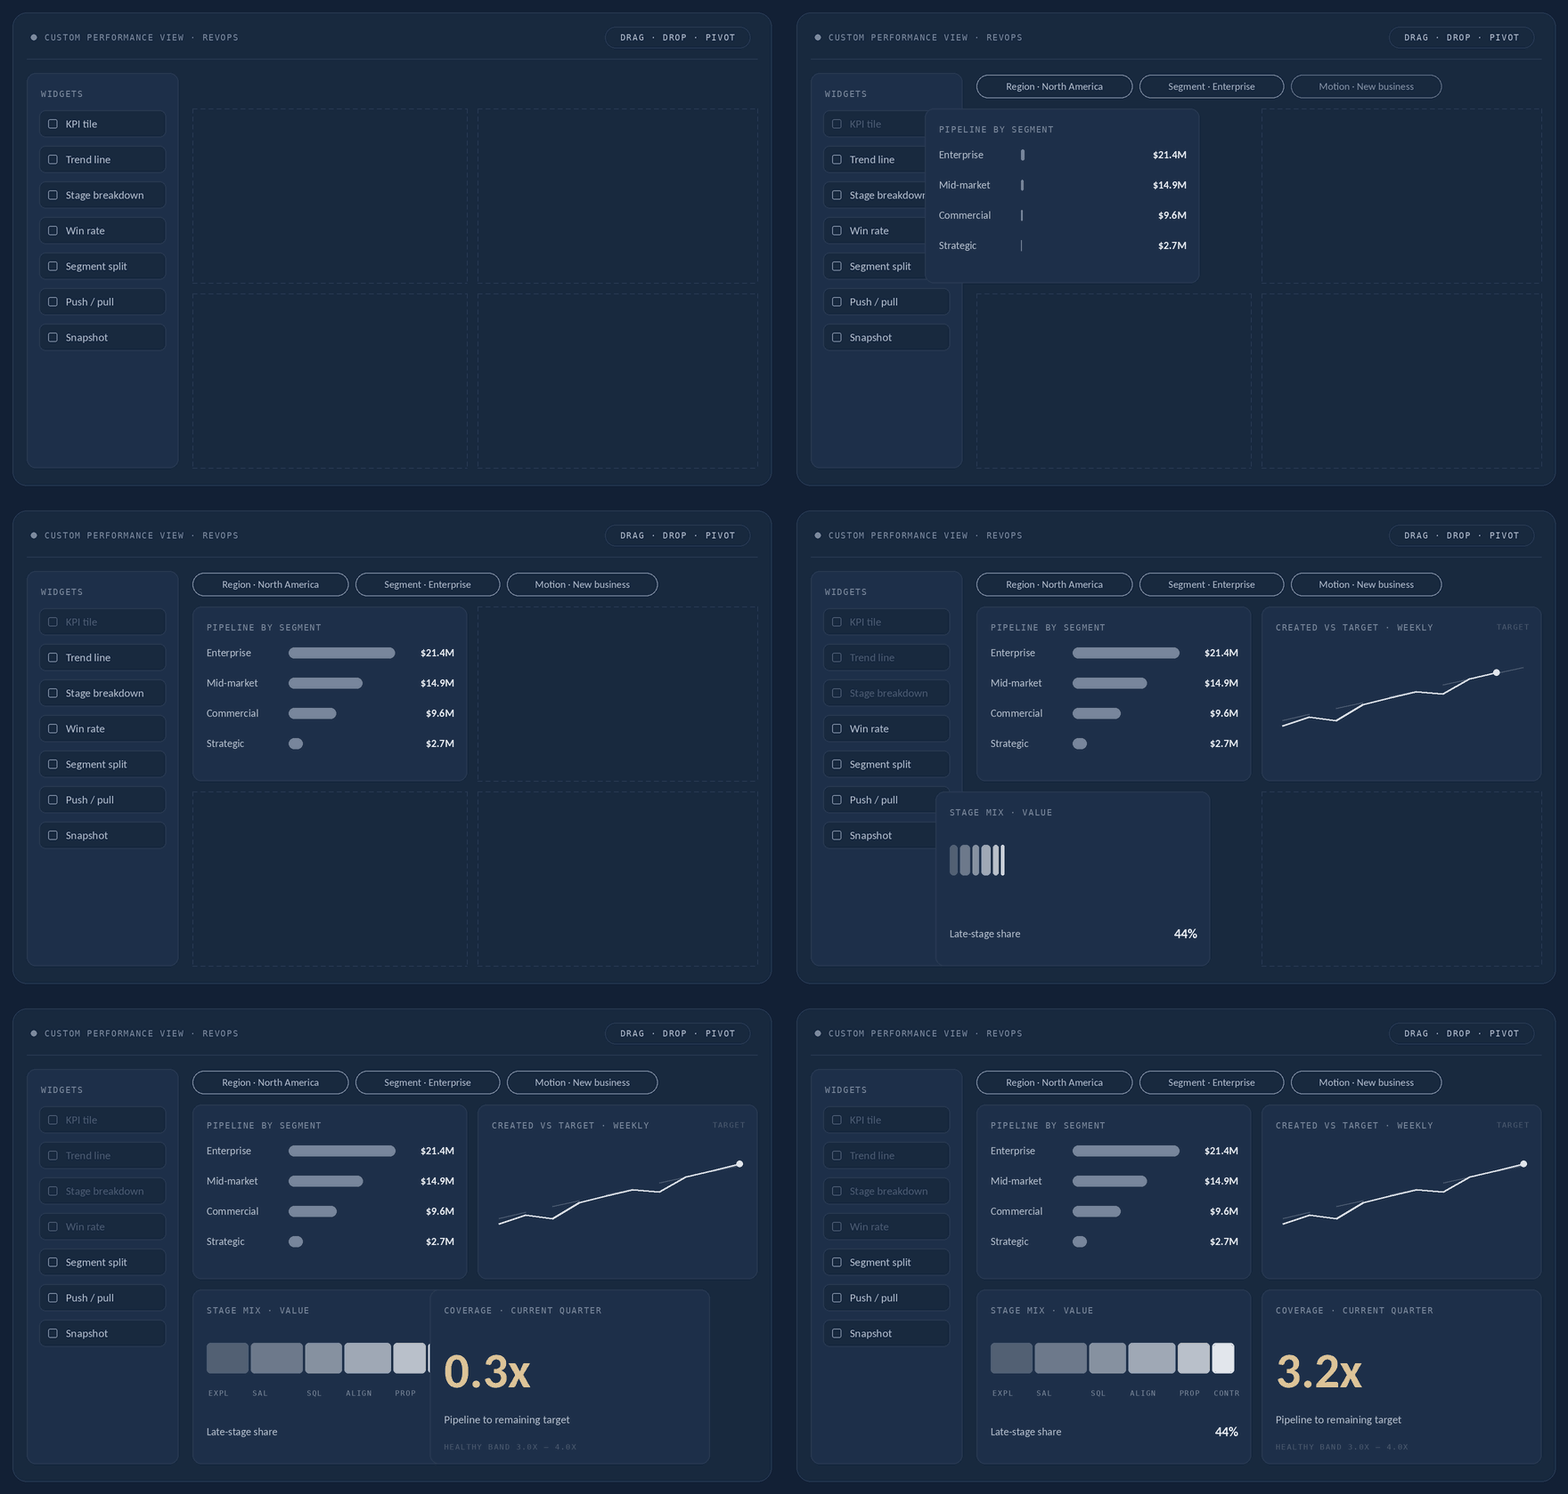
One workspace. Every cut of the pipeline
Get a multi-dimensional view of pipeline performance from a single, customizable analytics workspace. Analyze metrics across periods, segments, regions, and motions, then arrange the charts and KPIs that matter into a shared command center.
- Slice by time period, segment, region, and motion
- Choose only the charts and KPIs you track
- Filter and pivot to surface risks and opportunities
- Personal layouts per team, leader, or persona
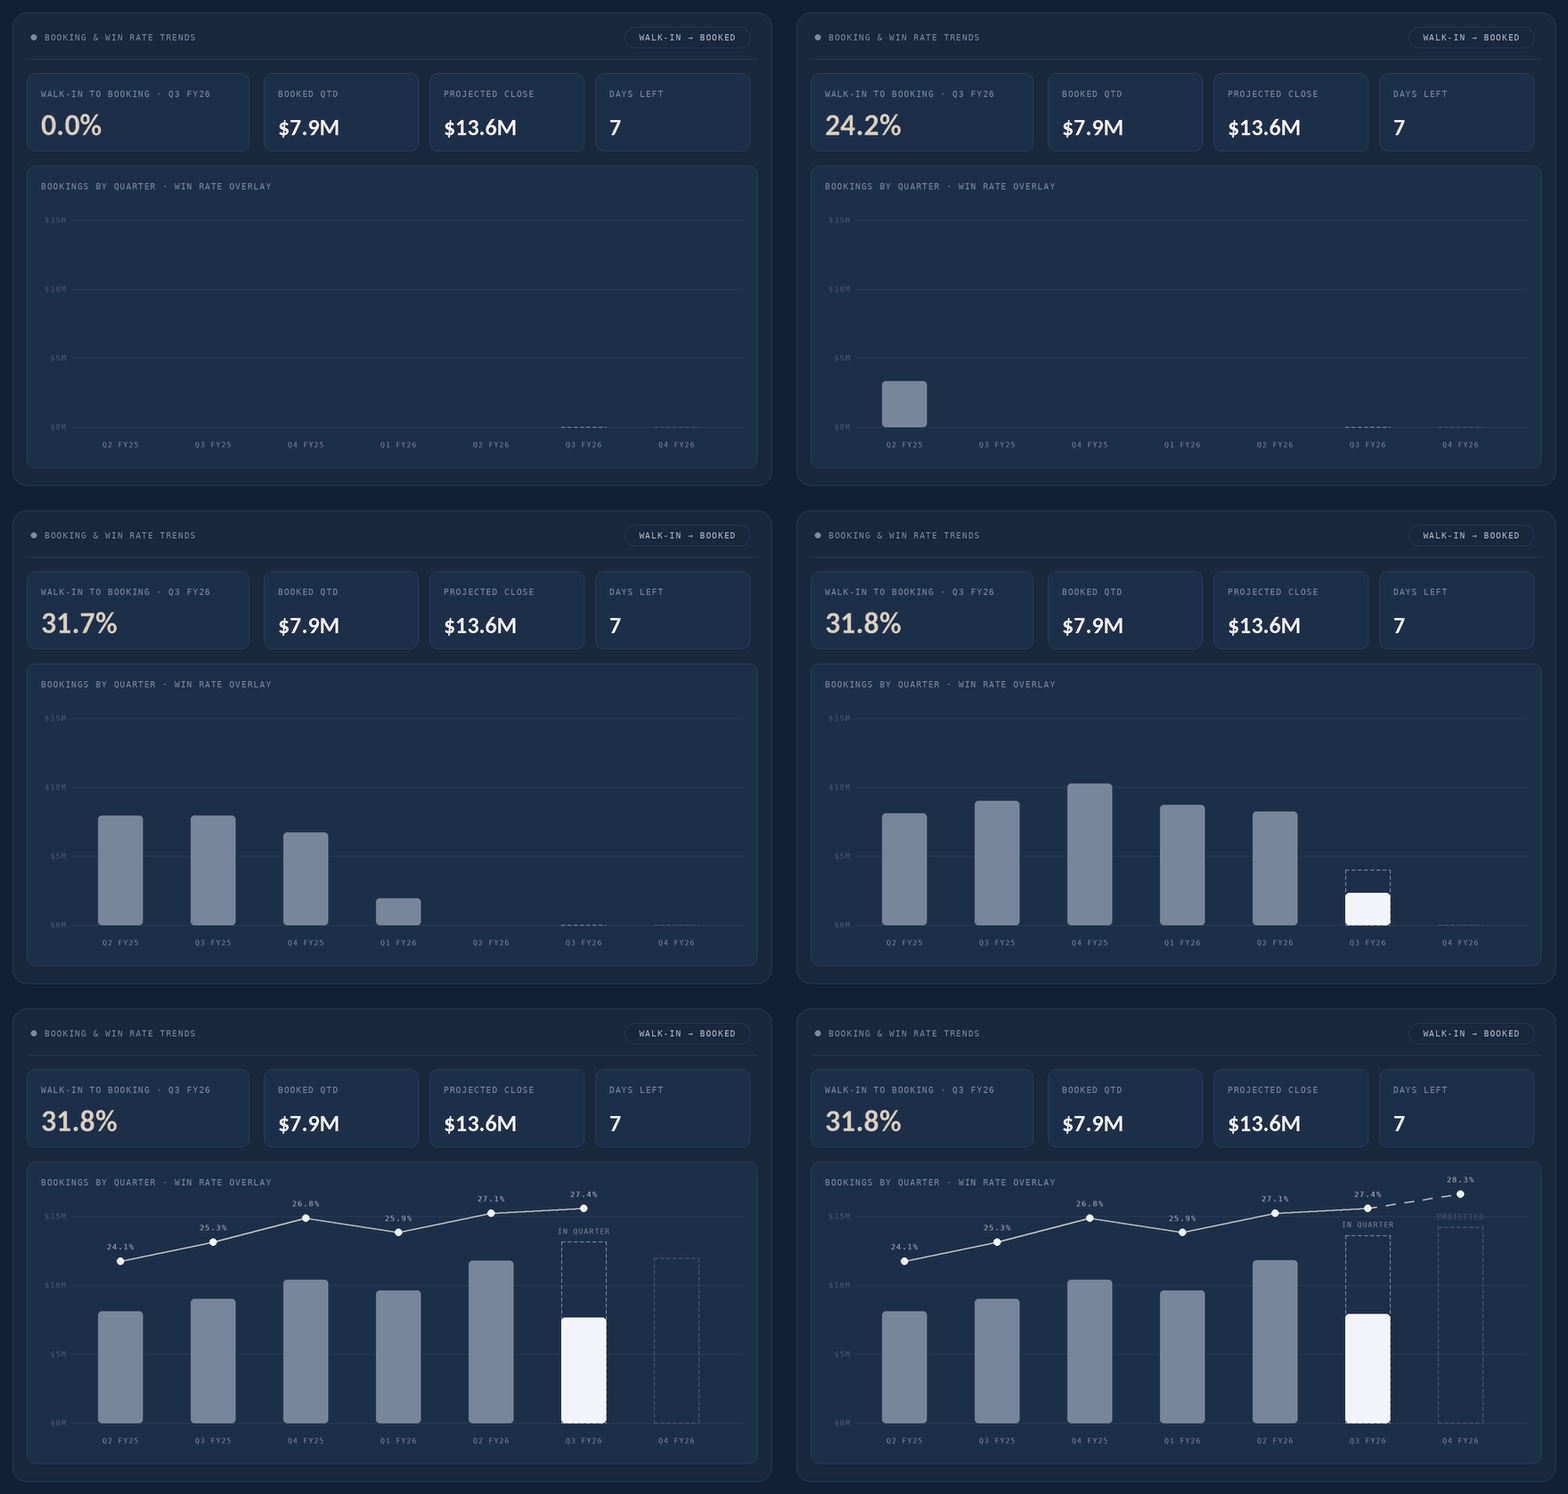
See which pipeline actually turns into bookings
Track historical results, current-quarter progress, and projected outcomes with pipeline conversion intelligence. Learn how effectively walk-in pipeline converts to bookings and which motions consistently lead to won deals.
- Historical, in-quarter, and projected bookings side by side
- Walk-in pipeline to booking conversion
- Win rate by motion, segment, and source
- One shared view of revenue performance
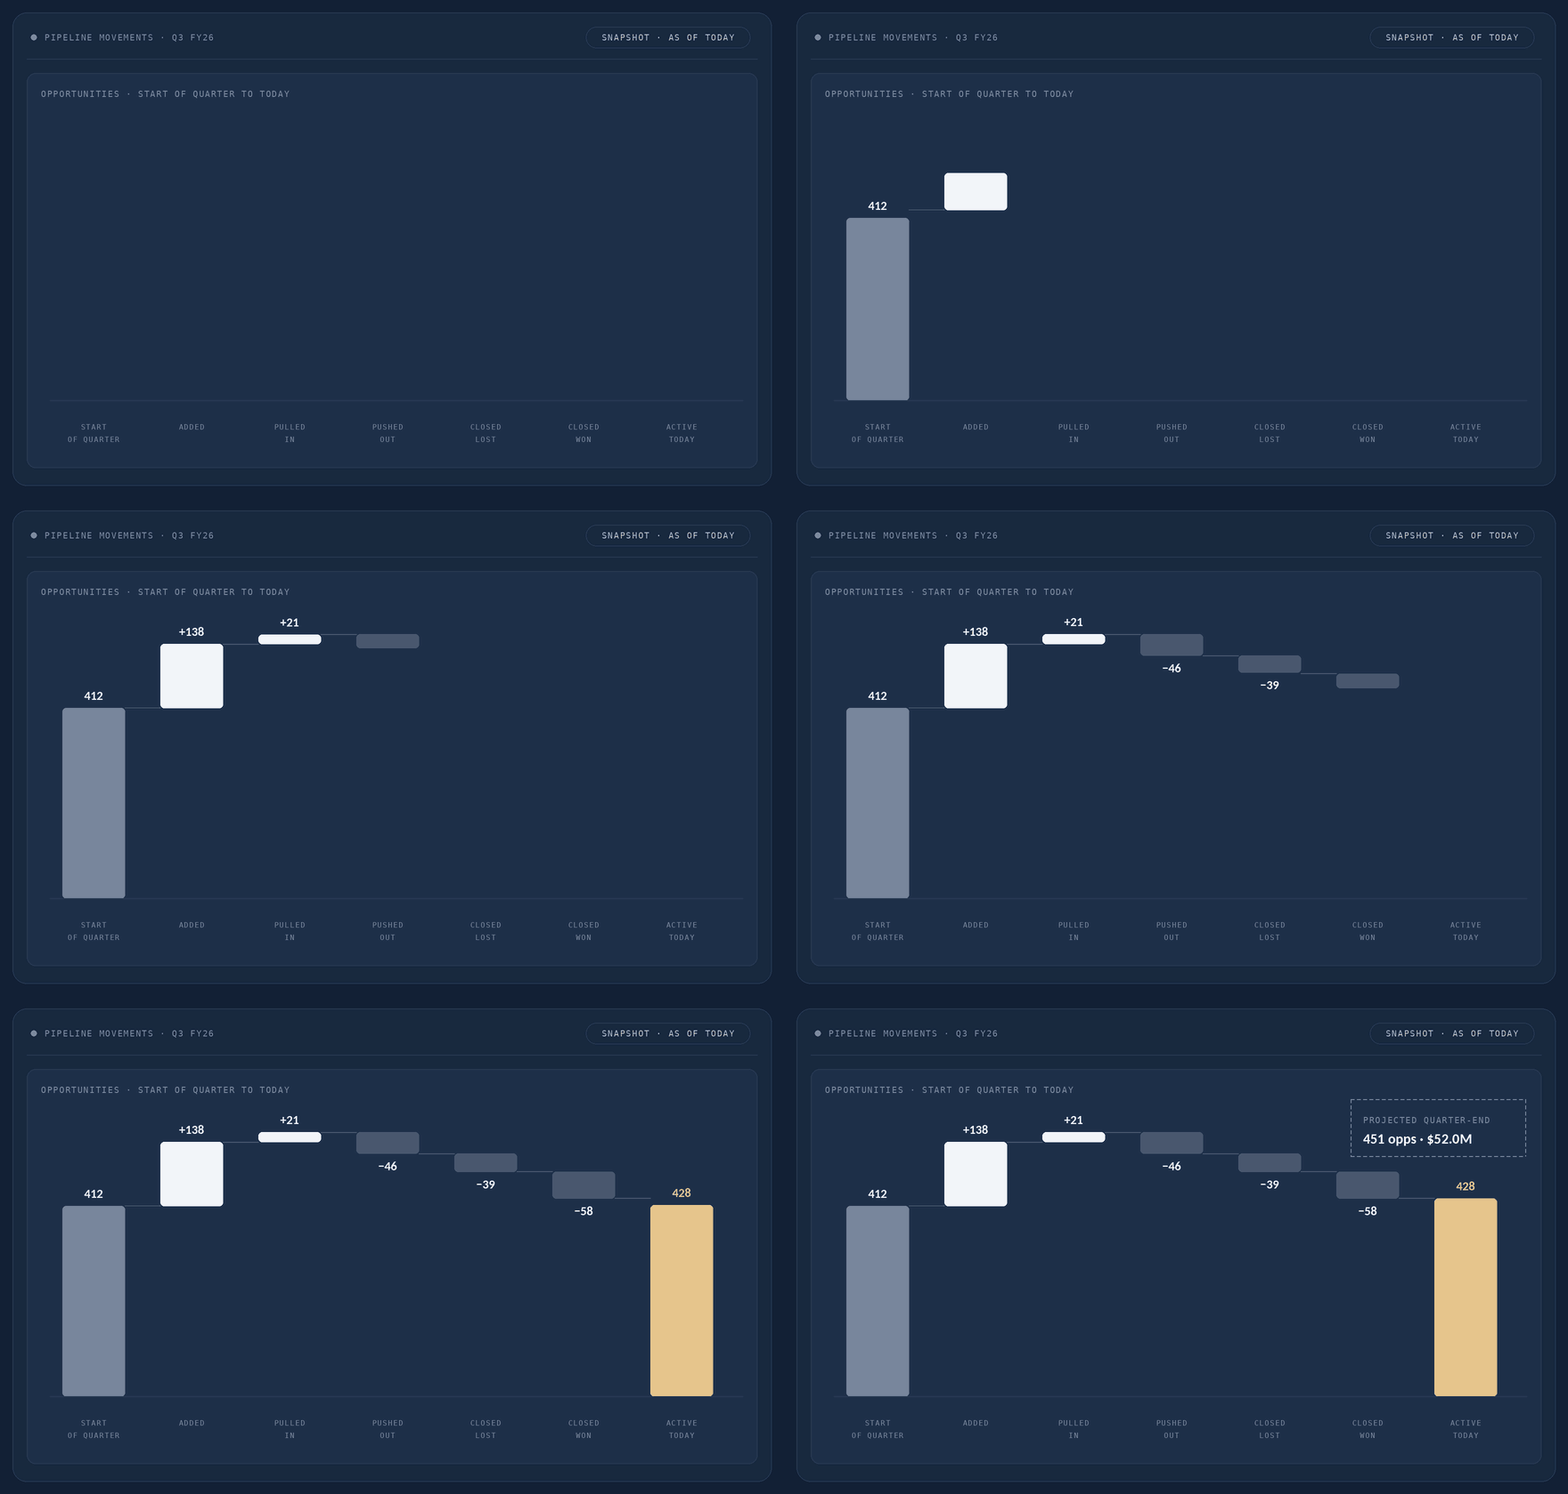
How the quarter moved. Not just where it ended
Pipeline Movements and Pipeline Snapshot show what was added, pushed, pulled, won, lost, and active at any point in time, alongside forward-looking projections.
- Start, added, pushed, pulled, and active at any date
- Point-in-time snapshots of quarter-end pipeline
- Forward-looking projections next to actuals
- Early read on stability and coverage risk
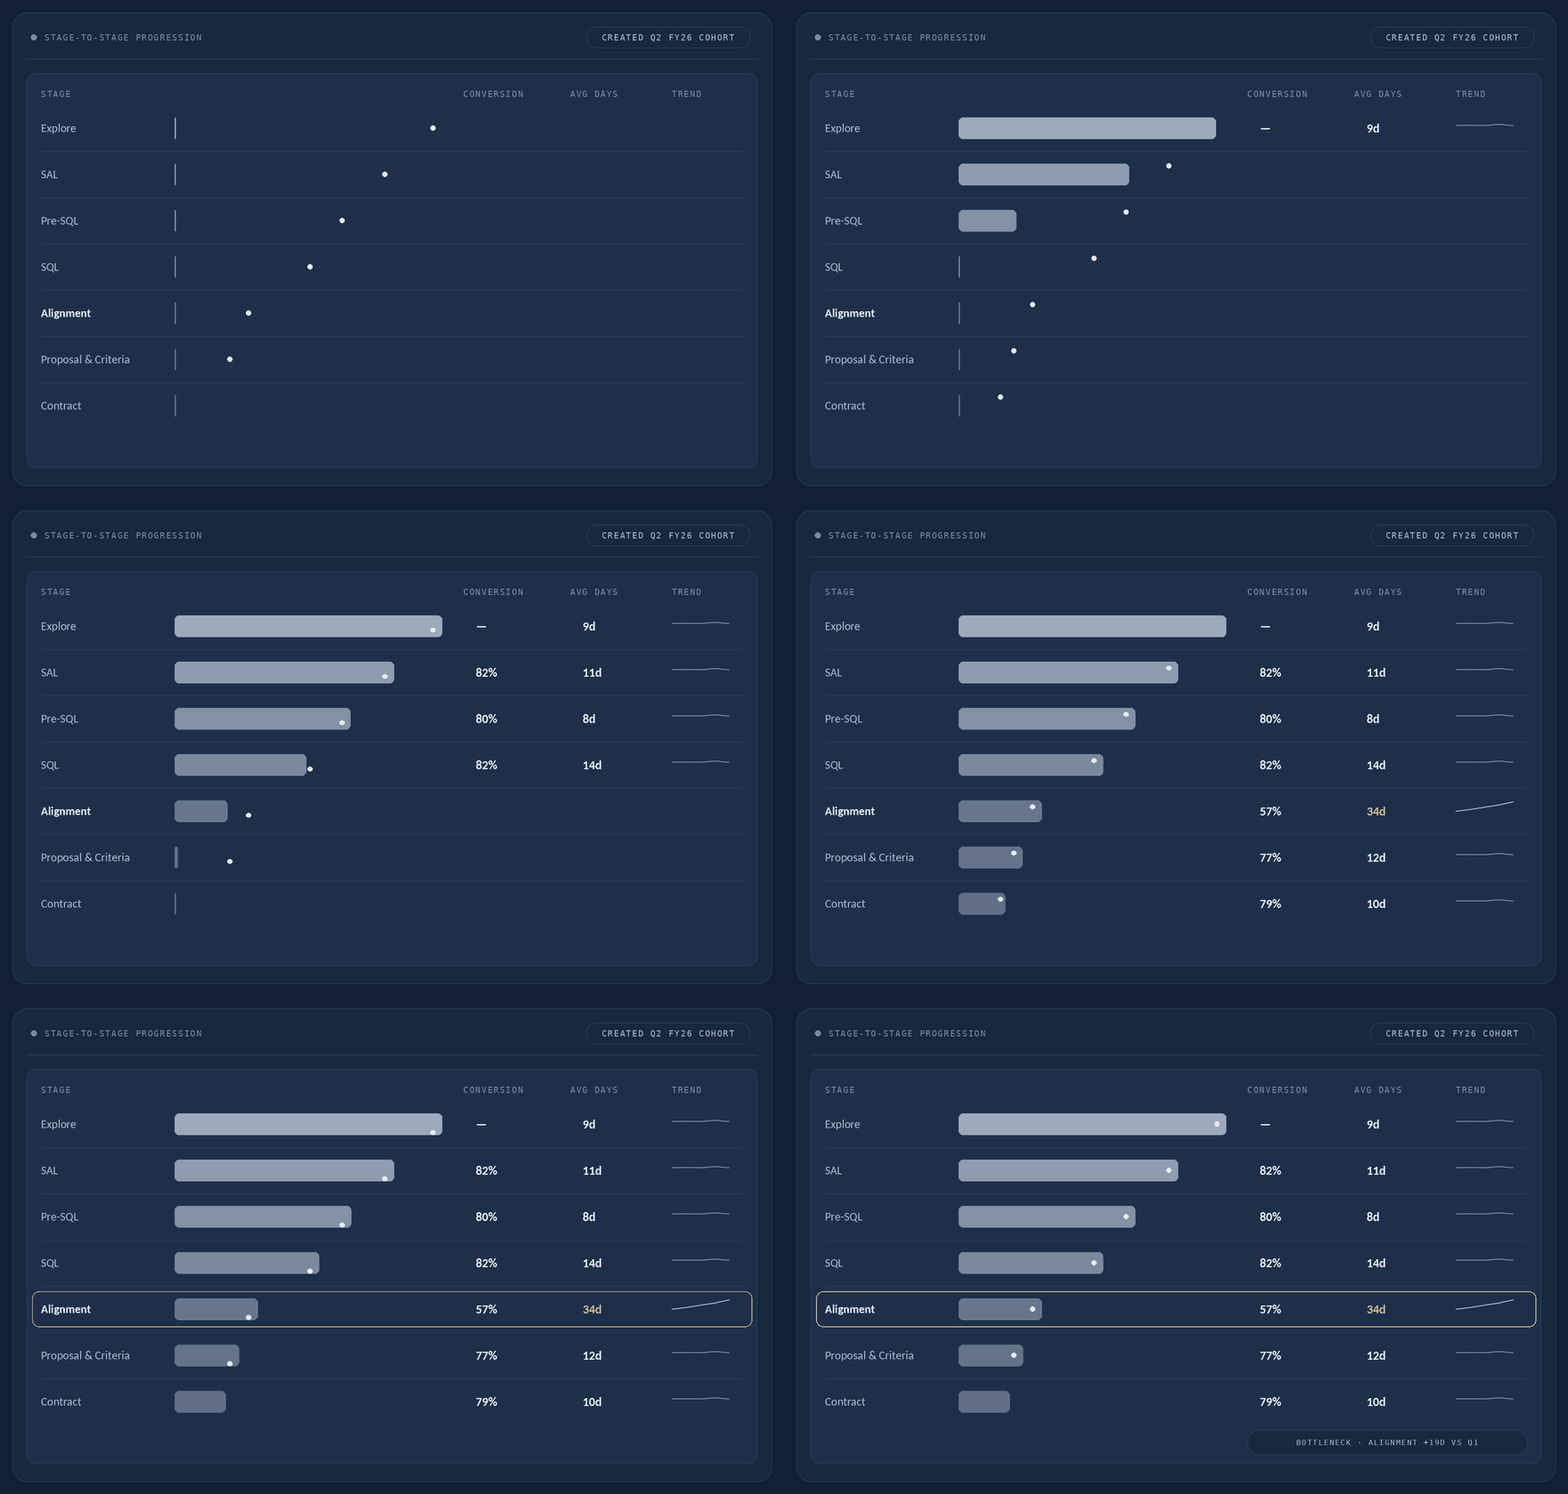
Find where momentum slows, while it still matters
Track stage-to-stage movement, progression to key milestones, and trends over time. Find bottlenecks early and identify patterns that correlate with stronger conversion.
- Stage-to-stage conversion and velocity
- Progression to key milestones by cohort
- Bottlenecks flagged against prior periods
- Patterns that correlate with won deals
Forecast the slippage, not just the pipeline
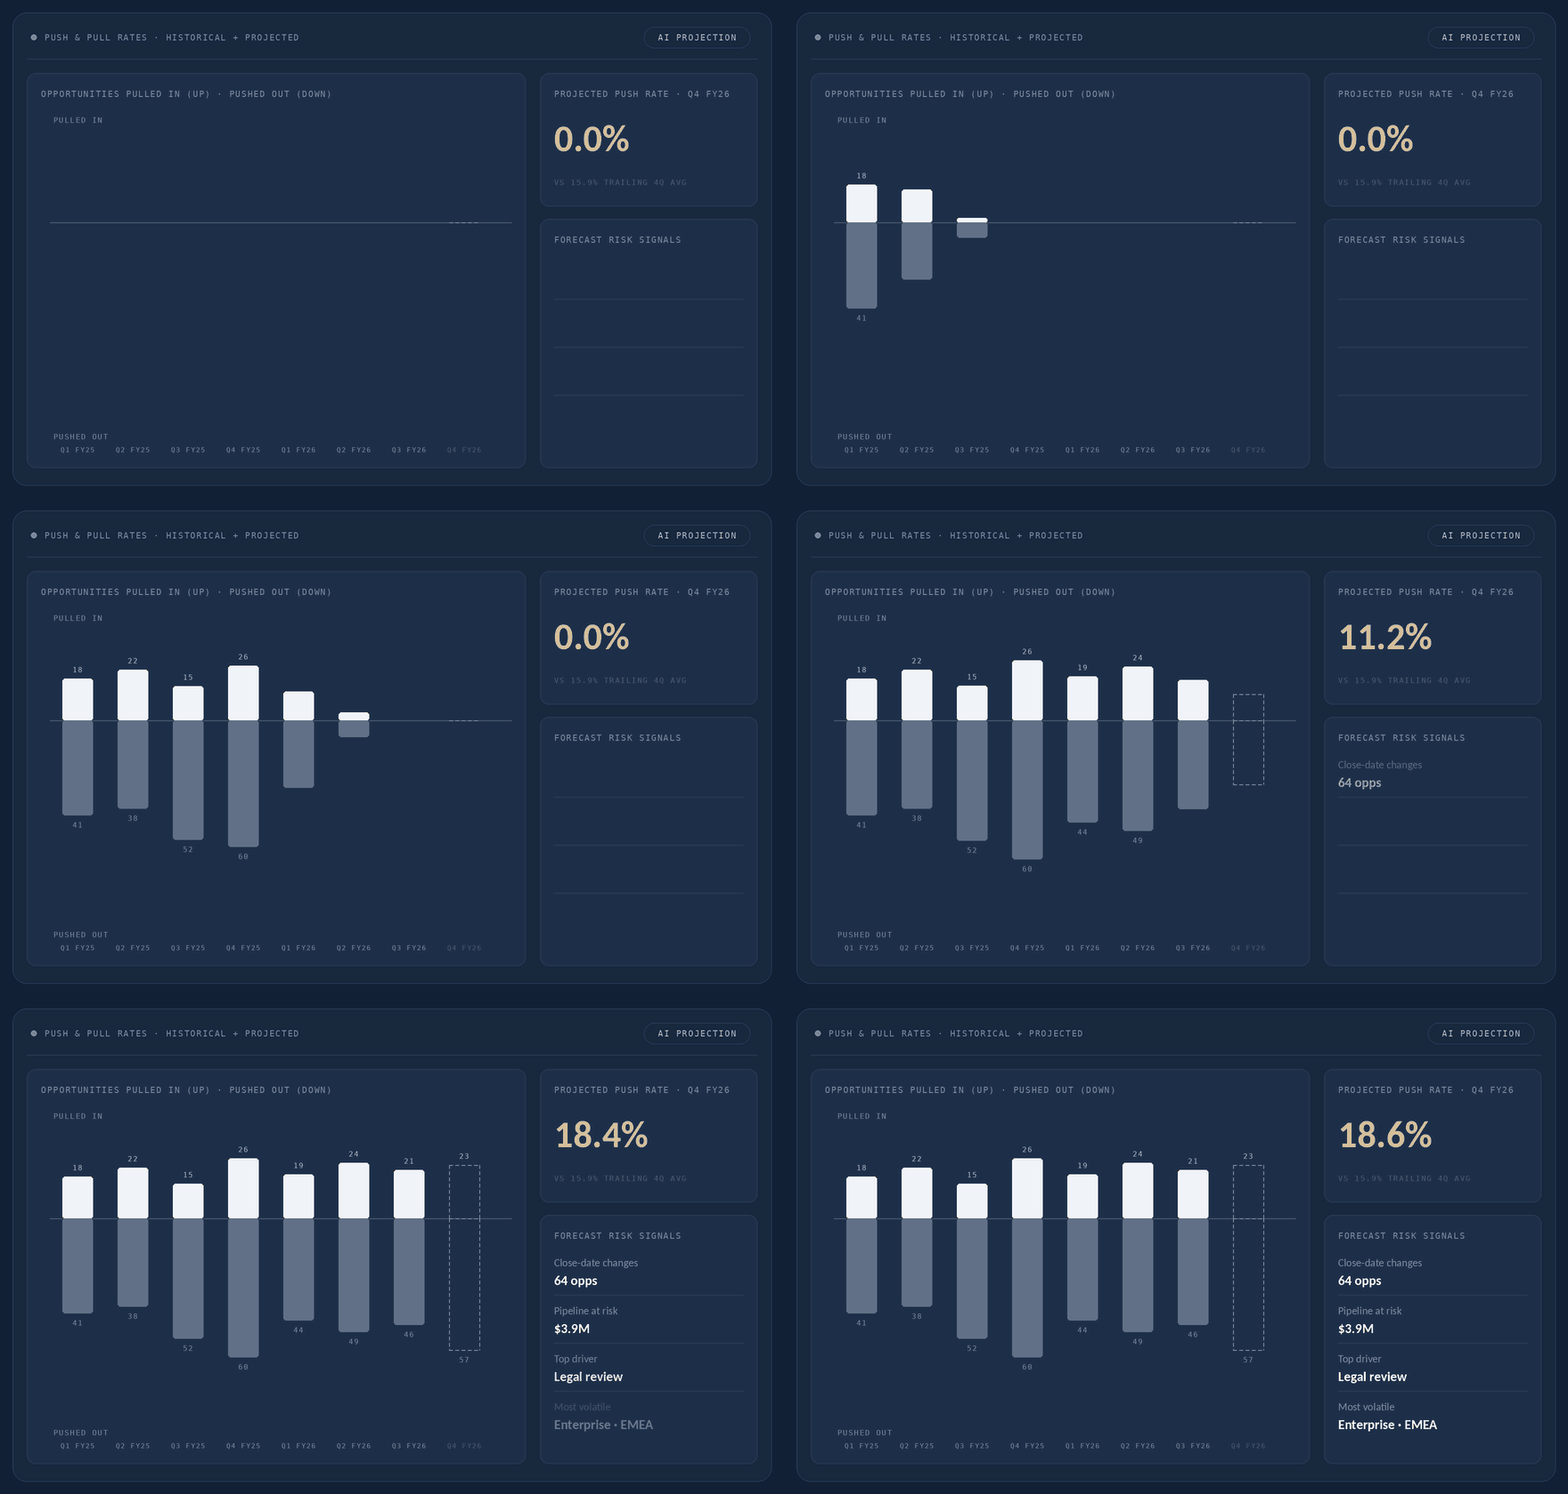
Track how often opportunities shift in or out of quarters. AI models expected future push and pull rates, so teams can anticipate close-date volatility before it affects revenue.
- Historical push and pull by quarter and segment
- Close-date changes before and during the quarter
- AI-projected push and pull rates
- Forecast risk surfaced weeks earlier
Pipeline analytics that looks forward
Movement, not snapshots alone
Every add, push, pull, and loss is tracked over time, so the quarter's story is visible while it is being written.
Projected, not just reported
AI models project bookings, win rates, and push and pull rates from your historical conversion patterns.
One pipeline every team trusts
Sales, marketing, RevOps, and finance read the same context layer, so the forecast call starts with a decision.
Questions, answered
What is pipeline analytics?
Pipeline analytics is the practice of measuring pipeline generation, movement, conversion, velocity, and forecast risk so revenue teams can understand how the quarter is likely to land and where to intervene.
How is pipeline analytics different from a CRM report?
CRM reports show fields and snapshots. Pipeline analytics connects historical movement, stage progression, win-rate trends, and projected outcomes in one view so teams can see both what happened and what is likely to happen next.
Can I segment pipeline analytics?
Yes. RevSure lets teams filter pipeline views by time period, segment, region, motion, source, and opportunity type, then save layouts for the people who need them.
What are push and pull rates?
Push rate measures opportunities that move out of their expected close quarter. Pull rate measures those that move in. Tracking both reveals close-date volatility that changes the forecast.
Can dashboards be shared automatically?
Yes. Teams can create tailored dashboards, organize them into tabs, and schedule daily, weekly, or monthly snapshots for stakeholders.
Stop reporting the pipeline. Move it
See how RevSure turns pipeline movement into a trusted decision before the quarter closes.