Data dictionary & reporting · RevSure FAQs
Reporting Tables- Pipeline by Quarter Start
Short answer
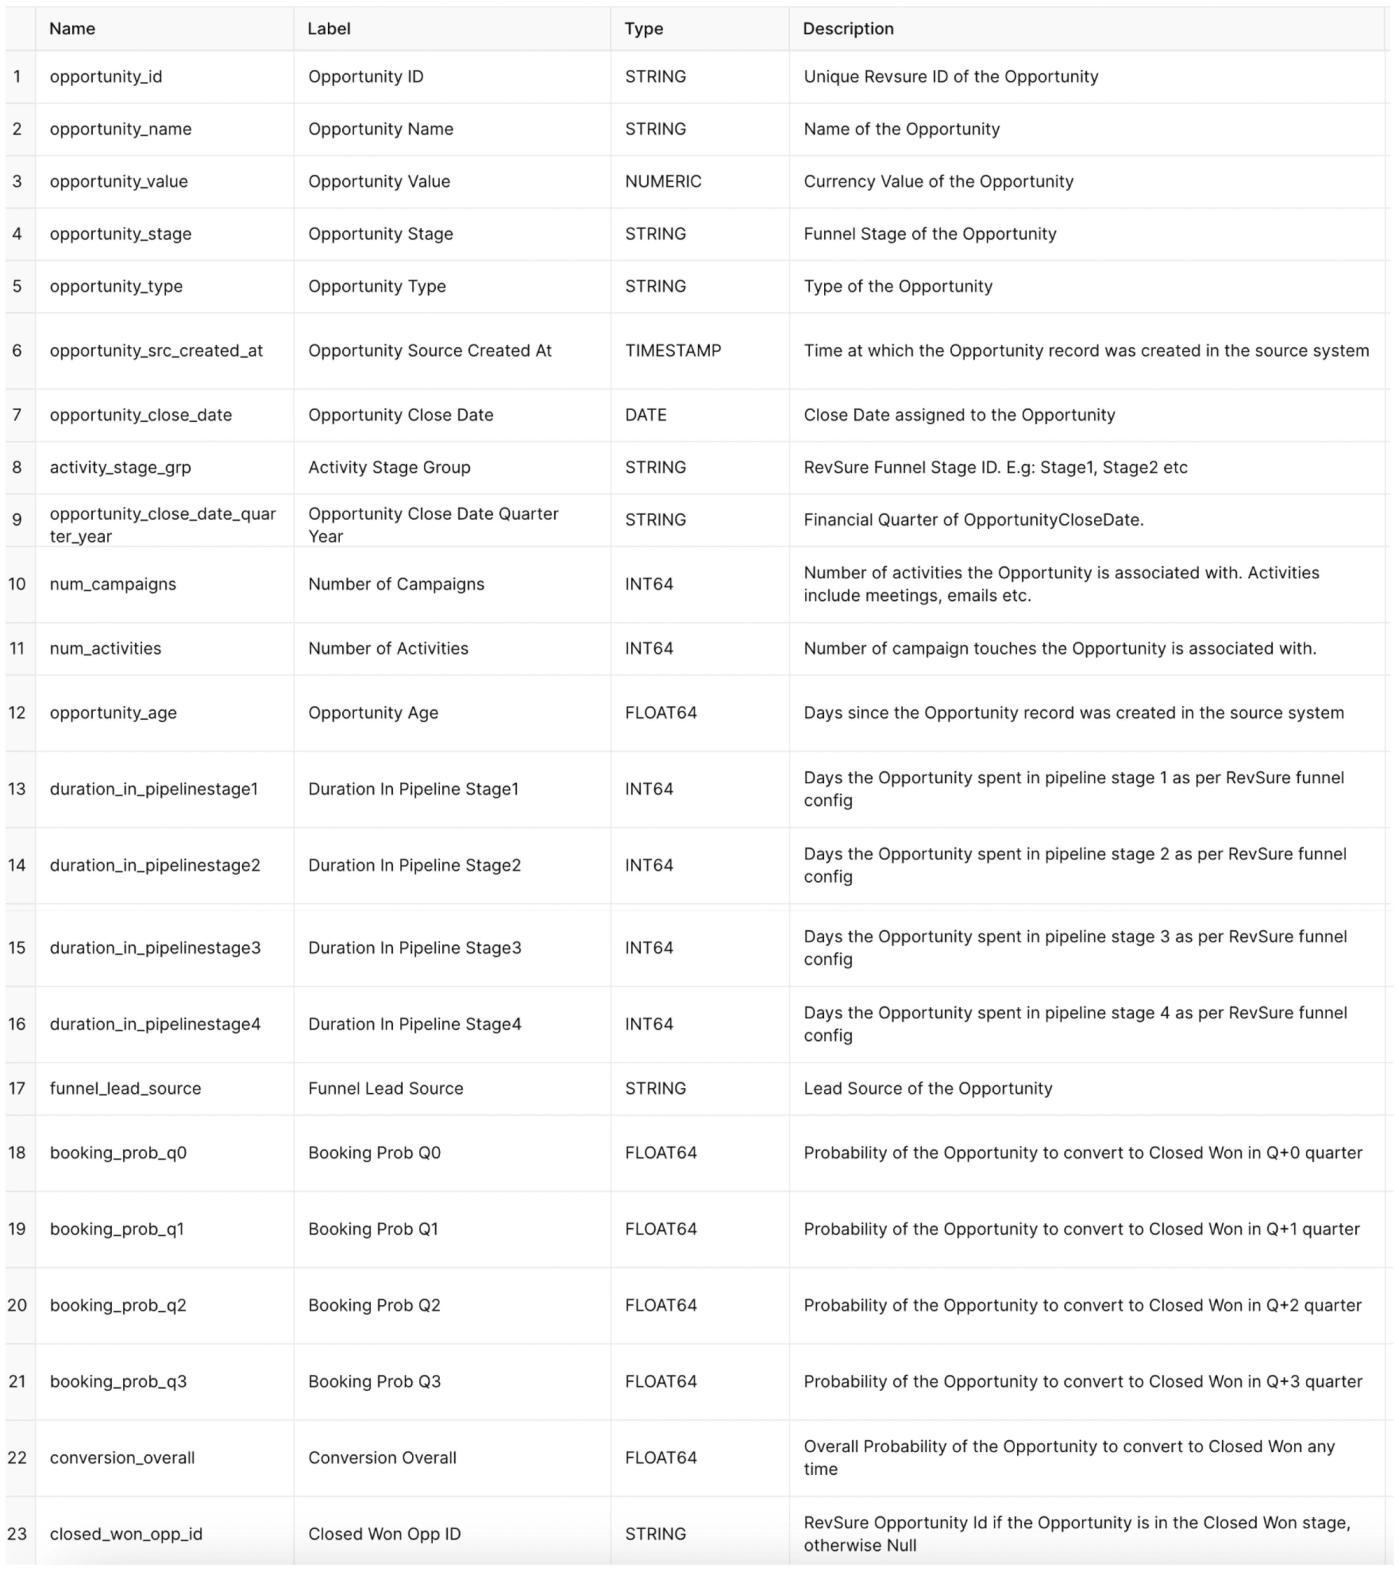
The Pipeline by Quarter Start reporting table snapshots pipeline as it stood at the start of each quarter. This reference describes its fields, useful for measuring how pipeline created versus converted within a quarter.
Ready when your stack is
Still stuck? Bring it to the session
A RevSure engineer walks your exact setup on a 30-minute working session.